

Last Updated on August 25, 2026
Beyond Revenue: KPIs for Measuring Ecommerce Success
Revenue alone doesn’t tell the full story of ecommerce performance. This article breaks down 16 critical metrics that reveal the real health of an online business, backed by insights from industry experts who track what actually drives sustainable growth. Understanding these key performance indicators helps businesses identify strengths, spot weaknesses, and make smarter decisions about where to focus their efforts.
- Cut Support Contacts per Sale
- Prioritize Full Price Sell Through
- Reduce Fully Out of Stock Footprint
- Judge Ads by Listing ROAS Threshold
- Lower Category Page Exits
- Boost Earnings per Product View
- Optimize Contribution Margin per Unit
- Increase Weekly New Items Published
- Grow Repeat Buyer Loyalty
- Watch Lead to Client Yield
- Monitor Add to Cart and Checkout
- Focus on Storewide Conversion Rate
- Elevate Unpaid Channel Revenue Share
- Maintain Healthy LTV to CAC Ratio
- Raise Autonomous Resolution for Inquiries
- Measure True Profit per Order
Cut Support Contacts per Sale
The number I watch closest is support contact rate: the share of orders that produce a customer message. Ours sits at 4%, and I would rather see that fall than see revenue rise in a difficult month.
It works as an early warning because almost every operational problem appears there before it appears in the accounts. A supplier changing a connector moulding without telling us, a courier quietly failing in one region, a product page with an ambiguous length description. None of that shows in a revenue chart for weeks. All of it shows in the inbox within days.
It is also the honest measure of whether the site is doing its job. Every message asking whether a cable fits a particular car is a page that failed to answer the question. We treat those as product data faults rather than support volume, because fixing the page removes the contact permanently instead of answering it faster.
The one that taught me this was a spike we could not explain. A batch of listings had inherited the wrong length in a bulk update, so people were ordering cables shorter than they needed. Revenue that week looked fine. The returns arrived a fortnight later, and by then we had shipped the whole batch.

Prioritize Full Price Sell Through
Our best revenue year was the one that nearly finished us. Everything sold, most of it in a January sale at something like forty percent off, and the bank didn’t care that the top line was a record.
Twenty-six years making and selling women’s outerwear online, and the number I run on now is full-price sell-through: 71 percent last season. Revenue counts a discounted coat and a full-price one the same way; margin doesn’t, and neither does the January warehouse.
Track what your own decisions control — I can’t make anyone spend more, but I can order three hundred coats instead of five. It reads badly in a growth year, when the denominator moves under you every drop. The Navy sells out by about October every single year and I still underbuy it.
The Complete 2025 E-commerce Manager Career Guide: From Entry-Level to Executive

Reduce Fully Out of Stock Footprint
The measure I watch that has nothing to do with revenue is the share of active products that are completely unavailable. When we first calculated it, around 16% of everything we were actively listing was out of stock across every variant — still indexed, still receiving search traffic, still impossible to buy. Revenue looked healthy because the products that did work carried the month. That number tells you how much of your storefront is a facade, and it degrades silently: nobody files a complaint about a page they quietly left. If I could give a store owner one measurement habit, it would be that one, checked weekly, before any dashboard about conversion.

Judge Ads by Listing ROAS Threshold
Break-even ROAS per listing. Revenue tells you the shop is moving; it doesn’t tell you whether the ads behind it are earning their keep. Every listing in my jewelry shops has its own break-even return-on-ad-spend derived from its margin, and I judge campaigns against that line over a two-month window — never on the blended number the ad dashboard’s header shows, because it mixes ad-driven sales with orders that would have arrived anyway. Anything living under its line gets switched off in a weekly review. Revenue can climb while this number quietly says you’re buying sales at a loss, which is exactly why I track it.

Lower Category Page Exits
The KPI we track most closely is category page exit rate. In a broad ecommerce catalog, category pages act as decision hubs for shoppers. When too many visitors leave there, it often signals a gap between what they expect and what they see. The issue may come from unclear sorting, weak visual structure, or limited confidence signals.
We value this metric because it shows experience quality before shoppers reach checkout. It helps us review navigation, filters, and how easily people can move from browsing to action. Lower exits often mean shoppers feel more informed and in control. That sense of momentum can be a strong sign of a healthy ecommerce experience.

Boost Earnings per Product View
Most ecommerce teams watch revenue first. I actually prefer revenue per product view because it’s much harder to hide problems behind it. Revenue can increase simply because you’re spending more on acquisition. Revenue per view tells you whether you’re making better use of every customer interaction. For me, that’s one of the clearest indicators of merchandising quality and overall store health.

Optimize Contribution Margin per Unit
Contribution margin per unit, calculated after every marketplace fee. Not gross revenue, not even gross margin. On Amazon that means landed cost, referral fee, fulfilment fee, monthly storage, aged inventory surcharge, returns processing, coupon or sale price give back, and advertising allocated at the SKU level. When you build that number honestly, some of your best sellers turn out to be the SKUs funding your problems.
The reason I insist on per unit rather than blended is that blended margin hides SKU level bleeding. I have reviewed accounts where the top three revenue SKUs were the only ones losing money, usually a heavy or oversized item whose fulfilment fee moved after a dimension re-measure, and nobody reran the math. Amazon changes fee tables and dimensional tiers regularly. If your margin model is a spreadsheet built at launch, it is wrong now.
The second number I pair with it is TACoS, total ad spend divided by total sales rather than just ad attributed sales. TACoS tells you whether advertising is buying organic momentum or renting it. Falling TACoS with flat revenue means your organic rank is doing real work. Rising TACoS with rising revenue means you are paying for growth you will stop having the moment you pause spend.
Revenue tells you the business is busy. Contribution margin per unit tells you whether being busy is worth it.

Increase Weekly New Items Published
Units listed per week. Revenue lags. If listing volume drops, revenue drops two to four weeks later. I have run Taylor Family Store that way since 2020, and it is why I built FlowLister: listing used to take 15-20 minutes each, so the bottleneck was never demand, it was getting items up. We track listings published per week as the leading KPI, then sold-through rate in 14 days as the quality check. About 300 customers later, the shops that win are the ones that keep listing, not the ones that stare at yesterday’s revenue.

Grow Repeat Buyer Loyalty
Beyond revenue, I measure success by whether Portraits de Famille is building lasting relationships rather than generating isolated transactions. The key KPI we track is Repeat Purchase Rate, because it shows whether customers genuinely value the product, brand and overall experience enough to return for another purchase.
This is particularly important for an artist-led fashion brand built around collectible releases. A strong Repeat Purchase Rate indicates that customers are connecting with the wider brand world and not simply one design. It also improves customer lifetime value and makes growth less dependent on repeatedly paying to acquire new customers. Revenue tells us what happened during a particular period, while Repeat Purchase Rate tells us whether we are building loyalty, community and a more resilient business over time.

Watch Lead to Client Yield
Revenue tells you something happened, but it does not tell you whether the business is actually getting healthier. One KPI we watch closely is lead to customer rate, since it shows whether the leads coming in are the kind our team can actually close, not just the kind that shows up in a report. A jump in traffic or inquiries means nothing if that rate is flat or dropping.
Beyond that, I care about repeat and referral business as a sign of whether customers actually trust us after the sale, not just during it. Revenue can hide a lot of churn underneath it, but if people are coming back or sending others our way, that tells me the experience we are delivering is working.

Monitor Add to Cart and Checkout
Revenue is a lagging indicator, and by the time it moves the real problem already happened weeks earlier. The KPI I actually watch first is add to cart rate and begin checkout rate at the GA4 level, not purchases.
On one ecommerce account I manage, the checkout flow itself had a bug that was suppressing purchase tracking, so purchases looked flat for months while real buyer intent, people adding products and starting checkout, was actually climbing. Revenue alone would have told a false story of stagnation.
Tracking that earlier signal let us keep scaling ad spend with confidence while the technical issue got fixed, instead of pulling back based on a number that wasn’t telling the truth yet.

Focus on Storewide Conversion Rate
There are a few things you want to track to gauge your own business or other e-commerce brands besides revenue. They tell you if the brand is growing in a sustainable way and how well they’re monetizing traffic. Ultimately, I think the single most important KPI to track is conversion rate. This metric basically tells you how many visitors became customers. It’s a very good reflection of your overall e-commerce health.

Elevate Unpaid Channel Revenue Share
Revenue can climb while the business underneath it gets weaker, so I ask a blunter question: how much of that revenue would still arrive if we switched the ads off tomorrow?
The number I track is the share of revenue coming from channels that do not have a meter running. Organic search, direct, email to people who have already bought, referrals. Paid sits on the other side of the line. Watching that split across rolling quarters tells you whether you are building an asset or renting one.
The figures vary by category, but the pattern holds. A store sitting below roughly 61% unpaid revenue is fragile in a way the profit and loss will not show until the auction gets more expensive, and it always gets more expensive.
I learned this properly from a business that came to us after a strong year and could not work out why cash felt so tight. Revenue had grown well. Almost all of the growth was paid, cost per order had crept up month by month, and the owner had been reading a chart that only pointed upward. The unpaid share had been falling the whole time and nobody was looking at it.
Revenue tells you what already happened. That split tells you what is about to happen, and it is the one number I would keep if I had to throw the rest away.

Maintain Healthy LTV to CAC Ratio
Most founders obsess over revenue growth while their business quietly bleeds out from the inside. When I was scaling my fulfillment company toward that $10M exit, I watched e-commerce brands celebrate record sales months while their repeat purchase rate collapsed. They were buying customers faster than they could keep them.
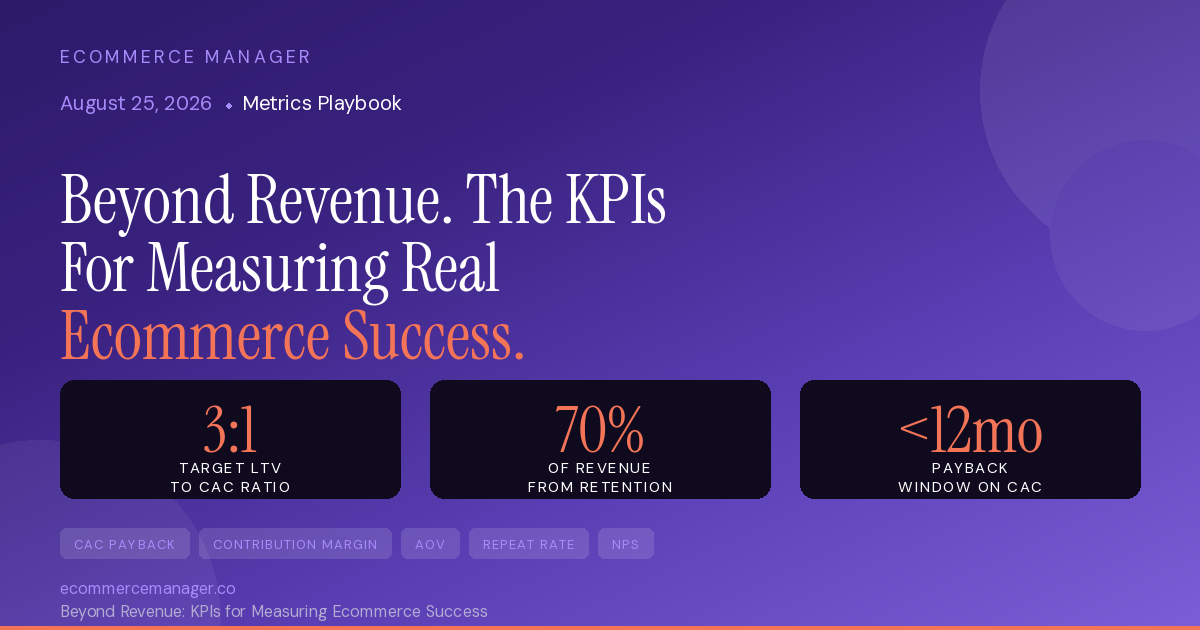
The KPI I track religiously is customer lifetime value to customer acquisition cost ratio. Not individually, but as a ratio. You need at least 3:1 to have a sustainable business. When I ran my seven-figure e-commerce brand, we hit 4.7:1 and that’s when everything changed. We could afford to outbid competitors for customers because we knew they’d come back.
Here’s what nobody tells you: revenue is a vanity metric if you’re burning cash to acquire one-time buyers. I’ve seen DTC brands do $5M in sales and still go under because their LTV:CAC was 1.2:1. They were essentially paying $100 to make $120, then spending that $20 on Instagram ads to repeat the cycle. It’s a death spiral dressed up as growth.
At Fulfill.com, when we analyze brands looking for 3PL partners, the ones with strong unit economics always have better fulfillment experiences. They can afford to use the premium 3PL that costs 80 cents more per order because they know that customer will buy six more times. The brands struggling to pay their fulfillment invoices are usually stuck in acquisition mode with terrible retention.
Track your LTV:CAC monthly. If it drops below 3:1, stop spending on acquisition and fix your product or experience first. I learned this the expensive way. Growth without retention isn’t growth, it’s just expensive churn with a marketing budget attached.

Raise Autonomous Resolution for Inquiries
Over my ten years scaling AI platforms, from my time at Leboncoin to building the customer agent OS at AGO, I’ve found that measuring e-commerce success beyond top-line revenue usually comes down to operational friction. The single non-revenue KPI we track most closely is the autonomous resolution rate.
We don’t measure ticket deflection, because deflecting a customer often just frustrates them. Instead, we track the exact percentage of customer inquiries that are fully resolved end-to-end by our systems taking real actions—like processing an exchange, updating a shipping record, or retrieving a specific policy—without a human agent ever needing to step in.
Revenue tells us if an e-commerce business is acquiring customers, but the autonomous resolution rate tells us if the underlying operation can actually handle the weight of that growth. If sales are climbing but the human support team is drowning in routine order status requests, the margins will eventually break. Tracking how many of those interactions are completed automatically gives us a direct, unfiltered look at back-office health.

Measure True Profit per Order
Revenue is a vanity number because it hides what it cost you to get it. You can double sales and go broke doing it. The KPI I actually watch is what’s left after everything, the real profit on an order once you subtract the product, the shipping, the payment fees, the returns, and the money you spent acquiring that customer.
Plenty of stores are proud of a big top line while quietly losing money on half their orders and not knowing it. Tracking true per-order profit tells you the uncomfortable truth: which products and which channels actually make you money versus which just make you busy.
Beyond that, the health signal I trust most is the return and complaint rate, because it’s the earliest warning that growth is hollow. If sales are climbing but returns and refunds are climbing faster, you’re not succeeding, you’re renting revenue from customers who’ll regret buying and never come back. A rising return rate predicts a shrinking future. So I’d tell any store owner: stop celebrating revenue and start watching profit per order and how many customers regret the purchase. Those two tell you whether you’re building something durable or just spending your way to a bigger number that isn’t yours to keep.

Related Articles
- 21 Ecommerce Data Analytics: Key Metrics to Watch – eCommerce Manager
- Using Analytics to Track Ecommerce Marketing: Key Metrics to Watch
- Top Analytics Tools for BigCommerce: Data-Driven Insights from E-Commerce Experts