

Last Updated on July 31, 2026
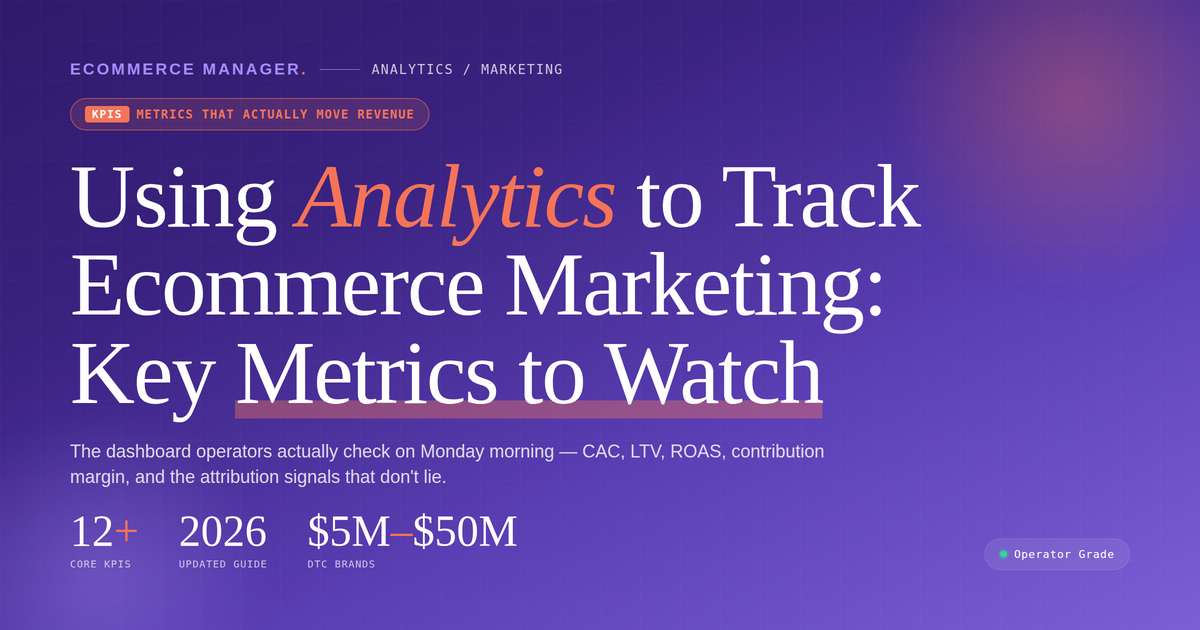
Using Analytics to Track Ecommerce Marketing: Key Metrics to Watch
Most ecommerce brands track the wrong metrics and waste thousands on underperforming campaigns. This guide breaks down the analytics that actually matter for profitable growth, backed by insights from marketing experts who have scaled seven-figure stores. Learn which numbers to monitor daily and which vanity metrics to ignore as you build a data-driven marketing strategy.
- Audit Gross Profit above Platform Numbers
- Calculate Server-Verified ROAS and Blended Return
- Balance LTV against CAC for Scale
- Prioritize Payback Period over ROAS
- Rank Pages by Organic Orders
- Assess Value per Session by Origin
- Judge Channels by Contribution Margin
- Guard Qualified Lead Ratio Relentlessly
- Watch Checkout Completion by Campaign
- Value Assisted Sales across Journey
- Grow Long-Term Customer Value
- Track with UTMs Focus on Acquisition Cost
- Elevate Live Mock-Up Engagement
- Measure Revenue by Entry Point
- Trust Margin-Adjusted Customer Cost
- Maximize Sales per Send
- Compare Source-Level Order Rates
- Monitor ACoS Daily on Amazon
- Emphasize Conversions and Close Ratios
- Center on Repeat Purchases for Retention
- Favor True ROI for Decisions
Audit Gross Profit above Platform Numbers
While a lot of agencies focus on ROAS and MER, the one metric we consistently come back to is gross profit.
Both have the same problem: they look accurate until they don’t. If a brand has been growing organically with no paid media, MER will look extremely high. The moment paid spend is added, it drops sharply, and it can look like something is going wrong when the business is actually healthier than before. ROAS has a similar issue: Facebook and Instagram take credit for sales that were already coming in organically, inflating the number before paid media had a chance to prove itself.
Gross profit cuts through both. The calculation is straightforward: start with the margin, subtract shipping and packaging, subtract ad spend, and look at what’s left. As long as that number is growing, the business is doing better.
The way we approach it in practice: we ask clients for a vague range of margin brackets per product. They don’t need to share exact costs. Even a broad range tells us whether a product can support the acquisition cost we’re generating. On the paid media side, we can see the exact spend per product across every campaign. That gives us a real picture of what each product is actually earning, not just what the platform is reporting.
We trust this metric enough that as a performance component, we’ll sometimes take a percentage of the gross profit we’re growing, not the ad spend and not the revenue, as long as we have complete control over all the marketing channels for the business.
Most analytics setups are built to show what the platforms did. Gross profit tells you what your business actually kept.

Calculate Server-Verified ROAS and Blended Return
How I track it: I tie every campaign back to real orders in the store’s backend, not just the clicks and conversions the ad platforms report. In practice that means server-side tracking. A server-side GTM container takes the purchase event from the backend and pushes the same verified event out to every platform that needs it: the Meta Conversions API, the GA4 Measurement Protocol, and Google Ads through enhanced conversions and the Google Ads API for conversion imports. The data comes from the server rather than the browser, and I reconcile it against the actual order database. This matters because ad blockers, iOS restrictions and cookie consent mean browser-only tracking quietly loses sales it never sees. Moving to server-side generally recovers around 30% more tracked conversions, and in some cases over 40%, though the exact gain depends on the store and how the tracking was built. Skip this step and you are optimising campaigns on numbers that are quietly wrong.
The one metric I focus on: ROAS, return on ad spend, measured against server-confirmed revenue rather than the figure the ad platform reports. Meta and Google both over-claim, taking credit for sales that were double-counted or never happened. A campaign can show 6x in Ads Manager and 3x against real orders, and those are two completely different decisions.
The part most people skip is reading ROAS at two levels. Channel ROAS, calculated separately for Meta, Google, email and so on, tells me which lever to pull. Blended ROAS, meaning all revenue divided by all marketing spend, tells me whether the business is actually growing. The gap between those two numbers is where the real insight sits. Every channel can report a healthy ROAS while blended sits flat, which usually means the channels are claiming the same customers twice, or paid is buying sales that would have happened anyway. Channel numbers on their own will cheerfully tell you everything is fine while the P&L disagrees. Blended is the honest check, and channel ROAS is how you act on it.
So the loop is: measure server-side so the data is trustworthy, judge each channel on its own ROAS, sanity-check the whole thing against blended ROAS, then move the budget.

Balance LTV against CAC for Scale
I use analytics to connect marketing activity back to real buying behavior, not just traffic. It’s easy to get distracted by clicks, impressions, and open rates, but the real question is whether the campaign brought in the right customer and moved them closer to purchase. For ecommerce, I like looking at the full path from first visit to add-to-cart, checkout, and repeat purchase so we can see where the campaign is working and where the customer is dropping off.
The key metric I focus on most is customer acquisition cost compared against customer lifetime value. A campaign can look successful on the surface because it drives a lot of sales, but if the cost to acquire those customers is too high, it’s not a healthy growth channel. Once you understand which campaigns bring in customers who come back, spend more, and engage with the brand over time, you can scale with a lot more confidence instead of just chasing short-term revenue.

Prioritize Payback Period over ROAS
I have been working as an e-commerce marketing analyst with over 6 years of experience tracking digital ad spend. We use a simple approach to measure the success of our marketing campaigns. We prefer the unified analytics dashboards to trace every dollar spent directly back to the specific ad group, email flow, or social link that brought the customer to our store.
The one key metric that I focus on above all else is the Customer Acquisition Cost (CAC) Payback Period. This tracks exactly how many months it takes for a new customer to generate enough gross profit to cover the cost of acquiring them. We don’t look at simple return on ad spend (ROAS) on day one. Tracking the payback period tells us whether our marketing campaigns are bringing in long-term, profitable shoppers.
The approach of focusing heavily on this metric changed our campaign performance over the past year by cutting budget from flashy top-of-funnel ads with long payback periods and moving those funds into retention-focused email tracks. This way, we reduced our average payback period from 7 months to 3 months. That doubled our available cash flow.

Rank Pages by Organic Orders
The metric I anchor on for ecommerce is organic conversion rate by landing page, not sessions. Traffic volume is a vanity number — a page can pull heavy organic visits and convert at near-zero, and that’s not an asset, it’s a liability eating crawl budget and diluting the URLs that actually earn.
The pattern I see on large catalog and programmatic sites: a narrow band of pages does most of the organic revenue, while thin templated variants drag the domain down. That’s the programmatic failure mode — when pages don’t match real intent, quality classifiers discount them and pull the rest with them. Sorting landing pages by organic CVR exposes which templates match intent and which just attract clicks.
Operationally, I review this weekly against a fixed triage order: indexing, internal links, intent alignment, external links. It’s also how I measure campaign work — template rollouts and internal-linking changes get judged on CVR shift per page, not traffic delta. Low-CVR pages get pruned, consolidated, or reworked. High-CVR pages get more internal link flow routed to them.

Assess Value per Session by Origin
The one metric I hold every campaign to at EV Cable Hub is revenue per session, split by traffic source. Clicks, impressions and even conversion rate can each flatter a campaign that is quietly losing money, but revenue divided by visits is hard to fool. It tells you what a visitor from that source is worth the moment they land, which is the only question the marketing budget cares about.
The campaign that taught me to trust it looked like a winner everywhere else. A social campaign was delivering clicks at around half the cost of our paid search traffic, and the dashboard glowed. But when I lined the two up on revenue per session, the social traffic was earning 80% less per visit. People were tapping through out of idle curiosity about electric cars, browsing a page and leaving, while search visitors arrived having typed the name of the exact cable they needed. Cheap traffic that does not buy is not cheap, it just spreads its cost over more disappointments.
So the weekly routine is plain. Each source gets its revenue per session tracked against its cost per session, and anything where the gap runs the wrong way for a few weeks gets cut or rebuilt, however handsome its other numbers look. The spend from that social campaign moved into search and into email, both duller and both better earners. My advice to any store owner drowning in dashboards is to pick the metric closest to money and let it govern. Most of the numbers analytics tools shout about measure attention, and attention pays no bills.

Judge Channels by Contribution Margin
About 70% of the reporting for ecommerce campaigns comes down to one question: did the traffic turn into profit, not just orders? The main setup is usually GA4 for channel and behaviour data, Shopify or WooCommerce for order data, and Looker Studio to join it into a weekly view by source, campaign, device and landing page. That makes it easier to see where people drop off, whether paid traffic is bringing first-time buyers or repeat buyers, and which campaigns are driving revenue after discounts and shipping.
The one metric I focus on most is contribution margin by channel, or at minimum MER (marketing efficiency ratio) if margin data isn’t clean enough yet. Revenue can look good while a campaign is still losing money once product cost, shipping, returns and ad spend are counted. In one skincare account, paid social was showing a 4.1x ROAS, but margin by channel showed only about 9% left after costs; changing budget toward Google Shopping and email flows took blended MER from roughly 2.8 to 3.6 over one quarter.
The most useful analytics habit is breaking results into new customer acquisition versus repeat purchase revenue. A campaign that looks average on first purchase can still be worth keeping if 60-day repeat rate is strong, while a high-ROAS promo campaign can train buyers to wait for discounts and hurt margin.

Guard Qualified Lead Ratio Relentlessly
At MacPherson’s Medical Supply, we run ecommerce marketing analytics like we run the rest of the business: if the numbers don’t tie to a real patient getting the right DME, respiratory support, or custom bracing, we’re not celebrating them. On macmedsupply.com and our paid campaigns, we tag every link by audience (veterans, Medicare families, complex rehab) and watch the full path in analytics plus our intake logs so we know which message actually produced a phone call or insurance verification form in the Rio Grande Valley, not just a bounce from someone price-shopping a commodity mask.
Every Monday I pull campaign reports with source/medium, landing pages, and event tracking on our high-intent buttons: click-to-call, request consultation, and insurance help. Families often research for weeks before they’re ready to talk about power mobility or orthotics, so I lean on assisted conversions and return visits. That’s the buying pattern we’ve seen for decades as a family-owned company since 1940, trust isn’t a one-click purchase.
The one metric I guard like inventory is qualified lead rate: sessions from a given campaign that end in a defined high-intent action divided by total sessions from that campaign. Traffic is cheap; a lead who needs documentation for Medicaid, VA, or TriCare and actually reaches our team is gold. If impressions climb but qualified lead rate drops, we don’t throw more budget at the ad, we fix the promise on the landing page, tighten geo around South Texas, or swap creative so we’re speaking to independence and coverage, not generic “medical stuff.”
We also use analytics to align marketing with what we can deliver responsibly, including respiratory seasonality and custom rehab timelines. That keeps our 80-year reputation ahead of short-term ROAS tricks.
Measure it all, but optimize for qualified leads. That’s what turns macmedsupply.com into appointments at 2325 S 77 Sunshine Strip, not just clicks.

Watch Checkout Completion by Campaign
I’ve been in digital marketing since 2011, and at Fusion One Marketing we use GA4, UTM tracking, PPC data, and dashboards like DASH so campaign performance is visible in one place.
For ecommerce, I tag every campaign with UTMs, then track GA4 events like product views, add-to-cart, checkout start, and purchase. That lets me see where the campaign is breaking down instead of only knowing that traffic showed up.
One key metric I focus on is checkout completion rate by campaign. If one ad group gets people to start checkout but they don’t finish, the issue may be shipping costs, offer mismatch, page speed, trust signals, or the landing page promise not matching the cart.
A practical example: if a spring promo is running on Google Ads and social, I don’t just compare clicks. I look at which campaign gets users into checkout and which one actually moves them through it cleanly, then shift budget and fix the weaker path.

Value Assisted Sales across Journey
We use analytics in layers to understand how each marketing effort performs. We begin by measuring channel inputs like click quality, audience match, and the mix of new and returning visitors. We then review on-site behavior, such as scroll depth, search refinement, category movement, and checkout hesitation. We connect these findings to each campaign so we understand whether revenue came from new demand or returning shoppers.
We also track assisted conversion rate because many shoppers do not buy during their first visit. We use this metric to understand how earlier campaigns support later purchases. It helps us recognize the value of upper-funnel marketing before the final purchase happens. We make better decisions because we see how each campaign contributes across the customer journey.

Grow Long-Term Customer Value
I use analytics to track the success of ecommerce marketing campaigns by following the customer’s journey instead of obsessing over vanity metrics. I want to know which traffic sources produce buyers, which pages create hesitation, and where people abandon the process. I once worked with a business that kept chasing more website visitors because traffic looked healthy on paper, but analytics revealed their biggest opportunity was improving the follow-up sequence for existing customers. After making a few strategic changes, repeat purchases increased without spending another dollar on advertising.
The one metric I pay the closest attention to is customer lifetime value because it tells me whether my marketing is creating lasting revenue instead of one-time sales. When lifetime value goes up, I know the business is getting more profit from the customers it already has, which is usually far less expensive than constantly acquiring new ones. My advice is to connect every marketing decision to revenue, not just clicks or impressions. Analytics become far more valuable when they help you identify where small improvements can create meaningful gains in profitability.

Track with UTMs Focus on Acquisition Cost
Understanding which activities are driving revenue is challenging. That’s why UTM / campaign URL tracking is essential for ecommerce marketing analytics. For example, you can understand which channels are performing well, but go even deeper and see which campaigns are performing well on those channels.
You can go even further to understand which images or pieces of content in those campaigns drive more clicks, or which CTA buttons performed best. If you’re smart with UTM tracking, you can really optimize your ad spend by understanding what performs best and where.
For example, I’ve run the same campaign on Facebook and Instagram before, but audiences have engaged with that content very differently. One preferred watching a video, whilst the other preferred clicking through to an article. Knowing this means I can tailor my campaigns to that platform better.
I use a UTM management tool called Uplifter, which enables my team and clients to create UTM links, QR codes and shortlinks to feature in our campaigns. The value here is ensuring there are no errors when creating campaign URLs. I’ve seen countless businesses produce unreliable campaign data because they create UTM links without governance.
My favorite metric is customer acquisition cost because instead of just asking, how much revenue did we make, it asks… What was the cost to acquire each customer? From which you can understand your marketing ROI. This is far more valuable overall. Fortunately, Uplifter also includes a campaign ROI planner that helps forecast expected returns based on previous campaign performance, which is particularly useful when trying to secure marketing budgets from stakeholders.

Elevate Live Mock-Up Engagement
As the co-founder and Chief Operations Officer of Mercha, where we run a tech-first B2B e-commerce platform, I treat data as our compass. Because we have streamlined the entire ordering process into a three-step online system to cut middleman costs, our analytics are geared entirely toward identifying friction points in that digital journey.
When tracking our campaigns—such as our End of Financial Year (EOFY) B2B marketing—we closely monitor how customers transition from initial touchpoints to the live, self-serve customisation phase. The single key metric I focus on is the Live Mock-Up Engagement Rate, which measures how many users upload their logo to see an instant design preview.
For us, a customer who interacts with our instant mock-up tool is highly qualified and has moved past simple browsing. By tracking this specific interaction, we can immediately see which targeted email segments or landing pages are attracting high-intent buyers who want to try before they buy.

Measure Revenue by Entry Point
The metric I trust most is revenue by landing page — which entry pages actually turn into orders, not just traffic. We attribute each sale to the page the customer entered on, which instantly shows whether a campaign or collection drives real money or just visits. It also catches money-makers you’d otherwise miss: pages with little search traffic that quietly convert via direct or social. Sessions and clicks flatter you; revenue-per-entry-page tells the truth.

Trust Margin-Adjusted Customer Cost
I use analytics by connecting the whole path: ad click, landing page behavior, email/SMS follow-up, cart, purchase, and repeat purchase. If those live in separate dashboards, you’re usually just confirming bias.
At The Idea Farm, I look at ecommerce campaigns as a growth system, not “did this ad get likes?” My first question is: did the campaign create profitable buying behavior the business can actually fulfill?
One key metric I focus on is gross-margin-adjusted customer acquisition cost. Plain ROAS can lie, especially if a product has thin margins, discounts, returns, or high shipping costs.
Example: if a campaign drives sales but only through heavy discounts, I’d rather know that early than celebrate revenue. The useful dashboard shows which message, product, and channel brought in customers at a cost the business can keep scaling.

Maximize Sales per Send
22 years running campaigns and building out ecommerce sites will teach you fast that vanity metrics will bleed your budget dry. I’ve seen clients obsessed with traffic numbers while their revenue flatlined.
The metric I keep coming back to is Revenue Per Send in email and, more broadly, revenue attribution per channel. When we rebuilt a machine cutting tools manufacturer’s site, we didn’t just celebrate more traffic after each phase rollout—we tracked whether each specific improvement actually moved revenue. That phase-by-phase approach let us isolate what worked instead of guessing.
The thing most people miss is connecting behavior on-site to campaign performance. Before we recommended a single change on that project, we ran heatmaps and session recordings to see exactly where users were dropping off. That behavioral data told us the *why* behind the numbers, not just the what.
Bottom line: stop measuring campaign success at the click. Follow the user all the way through to the order. If your analytics setup can’t connect an ad impression to a completed purchase, you have a visibility problem, not a traffic problem.

Compare Source-Level Order Rates
Bootstrapping two companies for 6+ years means every marketing dollar has to justify itself. Early on I made the mistake most e-commerce founders make: I was watching traffic numbers and feeling good about them while actual conversions were quietly flat. Took about 60 days of that before I realized vanity metrics are just noise with a dashboard.
The shift that actually helped was building attribution backwards from the sale, not forwards from the click. What channel did the customer touch first. What did they touch last. Where did they drop. Once you map that, you stop optimizing for volume and start optimizing for the steps that actually close.
We run Pageloot as a self-serve SaaS with 20,000+ brands, so e-commerce customer behavior is something we watch constantly. The one metric I keep coming back to is conversion rate by traffic source, not blended. Blended conversion rate is almost useless because it hides the fact that your organic traffic converts at 4% and your paid social converts at 0.6%. If you don’t split those out, you’ll keep pouring budget into the wrong channel while your best-performing one stays underfunded.
The failure that taught me this: we ran a campaign that looked great on cost-per-click and had strong traffic volume. Took us three weeks to realize the traffic was bouncing at 80% because the landing page didn’t match the ad promise. The campaign “worked” by every top-funnel measure and lost money at the bottom. Since then, bounce rate by source is the first thing I check when a campaign launches, before I look at anything else.
The practical setup I’d suggest: UTM parameters on every link, source-segmented goals in whatever analytics tool you use, and a weekly habit of looking at drop-off by funnel stage rather than just total numbers. It takes maybe 20 minutes. Most teams skip it and then wonder why their reporting never explains what actually happened.

Monitor ACoS Daily on Amazon
ACoS is the one metric I check every day on our Amazon brand, everything else comes after that.
Our wall cleaner campaign ran at a 2.37 ROS through all of 2024. We pulled our PPC data into Google Sheets through Gorilla ROI and started tracking spend against actual returns daily instead of monthly, and by end of 2025 that same product was at 3.52 ROS.
Seeing the numbers every morning instead of pulling a monthly report is what moved that metric.

Emphasize Conversions and Close Ratios
With over 25 years leading CC&A and serving as an expert witness on search strategies, I build ecommerce analytics around each client’s specific definition of success instead of relying on standard tools alone.
We go beyond basic reports to track customized details such as lead scoring and engagement, new versus recurring visitors, and the breakdown between direct, organic, referral, and social traffic.
One metric I focus on is conversions and lead-close ratios because they show whether campaigns actually move prospects to completed actions.
This comes directly from our work creating tailored CRMs and marketing automation that organize lead data for clearer sales forecasts and retention programs.
Center on Repeat Purchases for Retention
At Portraits de Famille, we use analytics to track every stage of our ecommerce marketing campaigns. From traffic sources and conversion rates to post-purchase engagement. The single most important metric I focus on is repurchase rate. Customer retention is the real engine of sustainable growth: if a customer buys from us again and again, their lifetime value far outweighs the initial acquisition cost. By monitoring repurchase rate, we can see how well our campaigns are building loyalty and community, allowing us to invest more confidently in long-term relationships rather than constantly chasing new customers.

Favor True ROI for Decisions
I’ve spent nearly two decades at Foxxr turning SEO, paid traffic, and content into revenue, so my bias is simple: don’t let the dashboard impress you unless the cash register agrees.
I track campaigns with UTMs, GA4, Search Console, ad data, and funnel events: landing page visits, product views, cart actions, checkout steps, purchases, and revenue. If traffic is up but sales are flat, I look at bounce rate, session quality, and where users drop off.
The one key metric I focus on is campaign ROI: net profit from the campaign divided by campaign cost. ROAS can look pretty, but ROI tells you whether the campaign is actually worth scaling.
Example: if an ecommerce product page has strong traffic but weak revenue, I’d test the conversion layer before buying more clicks: reviews, clearer CTAs above the fold, better product images, live chat, and stronger copy that answers buyer objections.

Related Articles
- 21 Ecommerce Data Analytics: Key Metrics to Watch – eCommerce Manager
- WooCommerce Analytics: Expert Tips for Data-Driven Decisions
- Shopify Analytics: 12 Strategies for Data-Driven Decisions