

Last Updated on August 26, 2026
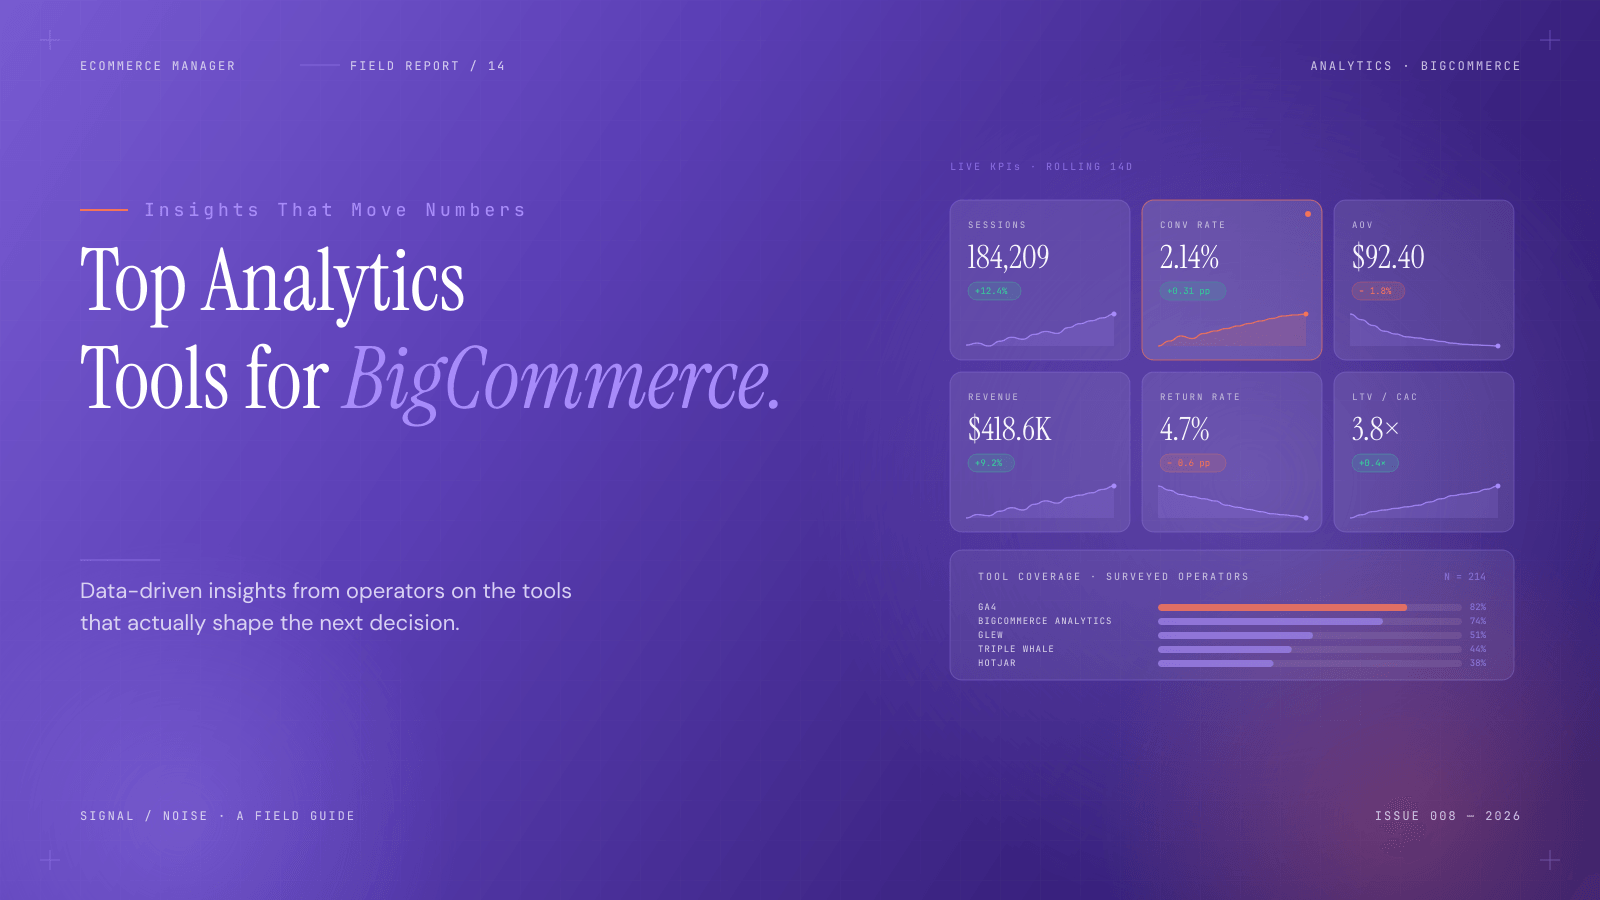
Top Analytics Tools for BigCommerce: Data-Driven Insights from E-Commerce Experts
Understanding which analytics tools deliver real results can transform an online store’s performance and profitability. This guide compiles proven strategies and tool recommendations from seasoned e-commerce professionals who have successfully scaled BigCommerce stores using data-driven decision making. Readers will discover how to boost repeat purchases, diagnose conversion stalls, leverage cohort analysis, optimize search performance, and fix mobile checkout issues.
- Unmask False Wins With Cohort Analysis
- Convert Impressions To Clicks With Search Console
- Resolve Mobile Drop-Offs With Funnel Insights
- Boost Repeat Buyers With Glew Data
- Diagnose Stalls With BigCommerce Analytics
Unmask False Wins With Cohort Analysis
The tool I recommend is less exotic than people expect: Google Analytics 4 paired with a simple cohort spreadsheet built from your store’s own order exports. The platform barely matters, whether it is BigCommerce, Shopify or anything else; what matters is pointing the tool at retention rather than getting lost in traffic vanity. GA4 tells me how people behave on the way in, and the cohort sheet tells me whether they come back, which is where the money sits.
The decision it drove for us was killing a discount-led acquisition push that looked successful on the surface. Sessions and first orders were up, and the campaign felt like a success. Then I built a plain month-by-month cohort grid and looked at second orders, and the customers we had acquired on that discount reordered at only about 11% within ninety days, far below every full-price cohort we had. We had been buying one-time bargain hunters and calling it growth.
So we stopped the discount as an acquisition tactic and moved the budget into channels that brought people who stayed. The wider habit I would pass on is to make one retention number, second-order rate by cohort, the figure you check every week, and to distrust any campaign that looks good only until you follow the customers it brought over time. Traffic is easy to celebrate and easy to fake; a cohort that comes back is neither.

Convert Impressions To Clicks With Search Console
The analytics tool I would point any store owner to is Google Search Console, because it shows the exact words people use to find you, and most shops barely open it. For a business like ours that lives on people searching for answers before they buy, it is the closest thing to reading your customers’ minds before they arrive.
The way I use it is to hunt for pages that are getting seen but not clicked. Search Console lists how often each page shows up in results and how often anyone clicks it, and a big gap between the two is a page that ranks but is being passed over, usually because the title does not match what the searcher hoped to find. That is a fixable problem hiding in plain sight, and the headline sales figures never show it to you.
The clearest example was one of our fitment guides that was appearing near the top for a valuable query and hardly being clicked. I rewrote the title and the summary line to say plainly what the page answered, changed nothing else, and clicks to it rose about 50% inside a month, which fed straight through to cable sales because the people arriving were ready to buy. No new content, no ad spend, just matching the promise to the question.
My advice is to stop staring only at the sales dashboard, which tells you what already happened, and spend time in Search Console, which tells you what people are trying to find and where you are letting them down. The demand is often already there in the data. You are just wording the door badly, and that is one of the cheapest things in the business to fix.
The Complete 2025 E-commerce Manager Career Guide: From Entry-Level to Executive

Resolve Mobile Drop-Offs With Funnel Insights
Recommendation for BigCommerce Analytics: GA4 Funnel Tracking & Data-Driven Case Study
For tracking and optimizing a BigCommerce store’s performance, the primary tool I recommend is Google Analytics 4 (GA4) paired with BigCommerce’s native ecommerce event integration. While BigCommerce provides solid high-level sales overview reports, GA4 gives you deep visibility into granular user behavior across every stage of the buyer journey.
Real Example: Using Funnel Data to Fix Product Page Drop-offs
A few months ago, while analyzing our Funnel Exploration Report in GA4, I noticed a distinct pattern: we had healthy store traffic coming from organic search and visual channels, but there was an unusually high drop-off rate (nearly 65%) between the “View Item” and “Add to Cart” stage on mobile devices.
Here is how we used that data to make an immediate, profitable adjustment:
Analyzing the Friction Point: We segmented the session data by device category and traffic source. The data revealed that mobile visitors were leaving the page without selecting sizing or color variations.
Identifying the Problem: We realized our mobile Product Detail Page (PDP) layout required too much scrolling to view sizing charts, fabric details, and shipping/return terms.
Data-Driven Execution: We revamped the mobile layout by implementing a sticky “Add to Cart” bar, introducing a quick-view popup sizing modal, and placing direct shipping/return micro-copy right below the product price.
The Outcome: Within 30 days of deploying these data-informed updates, our mobile Add-to-Cart rate jumped by 22%, and the overall store conversion rate improved by 1.4%.
Key Takeaway for Merchants:
High-level revenue metrics tell you what happened, but event-level funnel tracking in GA4 tells you why it happened. Pinpointing exact micro-friction points on product pages is where you find the highest ROI store optimizations.

Boost Repeat Buyers With Glew Data
Drawing from 8 years of e-commerce strategy experience, I highly recommend Glew.io for tracking and scaling BigCommerce store performance. Unlike standard analytics, Glew automatically combines store transactions, product margins, and ad spend into one unified reporting suite. One way I employ this data is through insights into customer acquisition at a product level.
After analyzing repeat purchase data in Glew, we discovered that those who were purchasing the particular entry-level SKU were 65% more likely to be repeat customers in 90 days compared to people purchasing premium products. We reallocated 40% of our ad budget on this entry-level product, reducing the payback time from 60 days to 18 days and increasing the customer lifetime value by 28% in 4 months.

Diagnose Stalls With BigCommerce Analytics
For BigCommerce clients, I start with the platform’s native Ecommerce Analytics because it connects product, customer and sales data without relying solely on browser tracking. One useful analysis is comparing product views with cart activity and completed purchases. If a product attracts plenty of attention but repeatedly stalls before purchase, I would not automatically spend more to promote it. I would first review the delivery promise, stock availability, pricing and product-page clarity. The important habit is using analytics to locate the broken decision, not simply reporting that sales rose or fell.

Related Articles
- Shopify Analytics: 12 Strategies for Data-Driven Decisions
- 21 Ecommerce Data Analytics: Key Metrics to Watch – eCommerce Manager
- WooCommerce Analytics: Expert Tips for Data-Driven Decisions