

Last Updated on October 27, 2026
Product Page Optimization in 2026: The Element-by-Element Data
Baymard's 2026 benchmark scored 30,000+ usability checks and found most product pages at well-funded retailers still mediocre. Here's the element-by-element data — reviews, media, speed, buy box — with the lift numbers and the traps.
On this page
The PDP is where the money decision happens, and most of them are still bad
Baymard Institute's 2026 Product Page UX benchmark, built from more than 30,000 manually scored usability checks at leading US and European retailers, found that 52% of desktop sites, 62% of mobile sites, and 64% of shopping apps have product pages rated mediocre or worse. These are big, well-funded stores. The gaps are specific and almost embarrassing: 37% offer no in-scale image, so shoppers can't judge size, and 89% never reply to negative reviews. The product page remains the least-finished page in ecommerce despite being the one where the purchase decision actually happens.
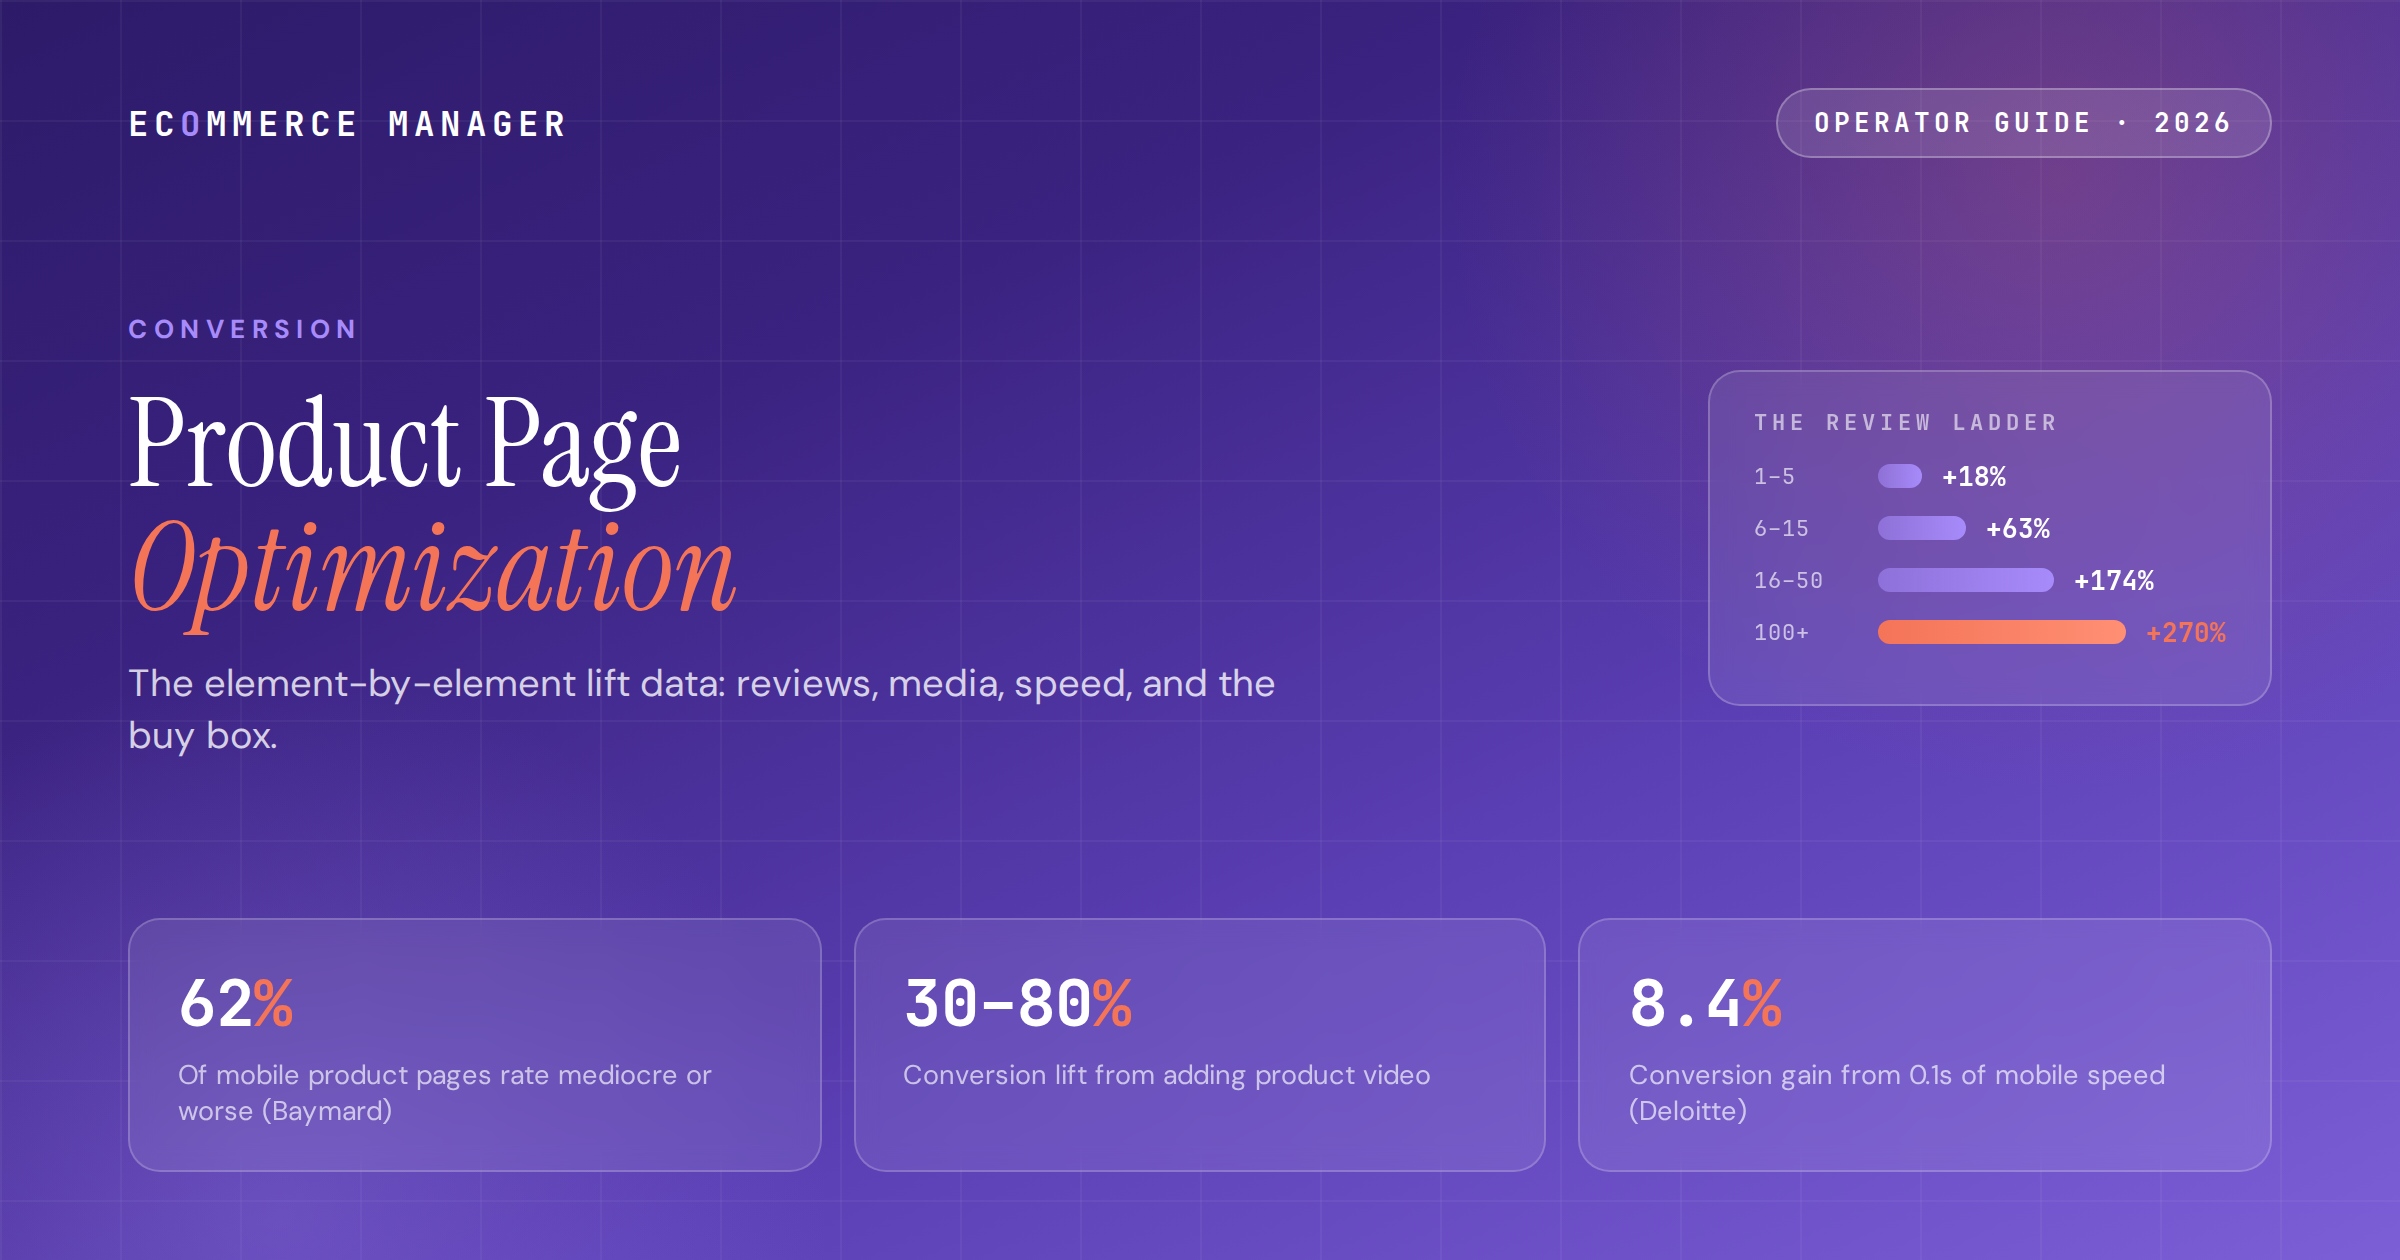
That's the opportunity, because the element-level data on PDPs is unusually precise. Spiegel Research Center's review ladder runs from +18% conversion at one-to-five reviews to +270% at scale. Product video lifts conversion 30–80% depending on category. Pages with 7+ images, video, and zoom convert 1.6–2.4x better than single-static-image pages. And Deloitte's Milliseconds Make Millions work puts a number on speed that reframes the whole engineering backlog: 0.1 seconds of mobile improvement lifted retail conversions 8.4%.
This guide walks the page element by element — media, reviews and UGC, speed, and the buy box — with the lift data, the named cases, and the two traps the averages hide: the image-count problem, where adding photos slows the page enough to lose more than the photos gain, and the measurement problem, where PDP work gets judged on the wrong metric. Session-level context lives in the ECM conversion benchmarks guide; this one is about the page itself.
What Baymard's 30,000 checks say about the average PDP
Before the lift numbers, the baseline: the documented state of product pages at retailers with real budgets. Audit your own pages against these specific failures first, because several are free to fix.
-
0152% of desktop PDPs, 62% of mobile PDPs, and 64% of app PDPs rate mediocre or worse in Baymard's 2026 benchmark. The mobile number is the one that matters: mobile carries roughly three-quarters of ecommerce traffic, and it's the worst-built surface of the three.
-
0237% of stores have no in-scale image, nothing showing the product next to a hand, a body, or a room, so shoppers guess at size, and guessing wrong becomes a return. For apparel and home goods this is the cheapest conversion fix on the list: one photo per product.
-
0389% of stores never reply to negative reviews. A visible merchant response to a two-star review is service proof exactly where skeptical buyers are reading, and the near-universal silence makes responding an easy differentiator.
-
0456% of shoppers explore product images before anything else (Baymard): before the title, the price, or a word of your description. The page's reading order is images, price, reviews, then maybe copy, which is why this guide's effort ranking starts with media and ends with description rewrites.
-
05The PDP's own conversion numbers to baseline before touching anything: add-to-cart from product pages at 5–10% for healthy stores (price- and category-dependent), PDP session conversion directionally at 1.5–3%, and cart abandonment averaging ~70% (Baymard) downstream. Log them per template in your core KPI set before the first change ships, or every improvement claim afterward is a guess.
Media: the biggest lever, and the image-count trap
Media is where shoppers start and where the largest controllable lifts live — with one well-mapped way to get it wrong.
-
01PDPs with 7+ images, a short video, and zoom-capable hero shots convert 1.6–2.4x better than single-static-image pages. The gallery that earns that multiple covers angles, in-scale context, texture detail, and the product in use — image-quality complaints appear in 38% of negative marketplace reviews, so the gallery is return-prevention as much as conversion.
-
02Product video lifts conversion 30–80% depending on category and quality. The named cases put faces on the range: Ariat saw video viewers convert 160% higher; Amazon's internal data has listings with video converting 5–15% higher; and short model-in-motion video cuts apparel returns by 11–17%. A properly lazy-loaded video adds under 100ms to the page, which removes the standard speed objection.
-
03Now the trap: going from 8 to 15 images often DROPS conversion 10–15%, because the speed cost outruns the persuasion gain, particularly on mobile connections. The pattern to internalize: media quality and coverage beat media quantity, every image ships compressed and lazy-loaded, and any gallery change gets measured with page speed in the same report. Eight good images that load fast beat fifteen that don't.
-
04Video reviews convert 4.1x better than text-only reviews, and photo reviews 2.6x better: customer-shot media outperforms studio polish for the trust job. goPure's UGC video engagers converted at 13% on average with peaks at 26%, and visitors who interact with photo or video UGC convert 103.9% more often than those who don't. The production bar is lower than most brands assume; the authenticity bar is the one that matters.
-
05The 2026 addition: your media is now an AI-answer surface. Product video and well-structured imagery are becoming citation material for multimodal AI search, which means the media investment compounds beyond the page itself; the same logic that makes AI citations a second scoreboard for SEO applies to the PDP's assets.
What's a point of PDP conversion worth to you?
Run your revenue, AOV, and conversion rate through the ECM Platform Calculator to price the improvement before you budget the work — the dollar figure picks the investment tier.
The review ladder: the steepest documented curve in ecommerce
Reviews have the largest measured conversion impact of any page element, and the data is granular enough to set collection targets from.
-
01The Spiegel/Northwestern ladder, step by step: 1–5 reviews +18%, 6–15 +63%, 16–50 +174%, 51–100 +243%, 100+ +270% versus zero reviews. The headline most people quote (five reviews makes purchase 270% more likely than none) compresses the curve; the operational reading is that the first fifteen reviews per SKU are the highest-ROI collection work in the catalog.
-
02The effect strengthens with price: higher-priced products see the larger review lift (one dataset has expensive items at +161% with reviews versus without), because risk is what reviews retire. Prioritize review collection on your highest-AOV SKUs first, not your bestsellers; bestsellers accumulate reviews on their own.
-
03Collection mechanics, benchmarked: post-purchase email requests convert 5–15% of customers into contributors, and roughly 10 reviews lifts conversion ~45% (with Bazaarvoice data adding ~10% more conversion per 10 additional reviews). The flow is mechanical: timed post-delivery request, photo/video prompt (the 2.6–4.1x formats), small incentive for media, every review on the page near the buy button.
-
04UGC galleries are the compounding layer: G-Star RAW added +18% PDP conversion from galleries alone, UGC-enabled pages run to 161% higher conversion in Bazaarvoice's data, and customer-photo pages show +91%. Syndicate the same assets into email (UGC lifts click-through 73%) and ads, where UGC-driven ad conversion hit 6.73x in Q1 2026.
-
05Answer the negative ones. The 89%-silence statistic from the audit section is the opening: a short, named, non-defensive merchant reply under every sub-3-star review converts the review section from a risk into a service demonstration. Pair it with visible Q&A; the decision-point objections buyers actually type are your best copy research for free.
Speed, the invisible tax, and the buy box that closes
Everything above sits on load time, and the decision moment sits in the buy box. The data on both is blunt.
-
01A product page loading in 1 second converts around 3.05%, and the gap to a 5-second page runs 2.5x (Portent). Deloitte's retail study makes the marginal case: 0.1 seconds of mobile speed improvement lifted retail conversions 8.4%. The budget conversation changes when a tenth of a second has a revenue number attached.
-
02The PDP speed punch list, in payoff order: compress and lazy-load the gallery (images are the usual LCP offender; target main image under 2.5s on mobile), defer third-party scripts, and audit the review/UGC widgets you just added, because trust apps are a classic speed tax worth a line in your tech stack audit. The Core Web Vitals thresholds here are the same ones that govern replatforming SEO outcomes.
-
03The buy box carries five jobs: price with no surprises, shipping cost and date, returns in one line, stock honesty, and one unmistakable add-to-cart. Unexpected costs are the most-cited abandonment driver downstream (~70% average cart abandonment), and pulling shipping and returns clarity up onto the PDP is where part of that leak gets fixed, before the cart ever renders.
-
04Express wallets close the distance between decision and payment: Shop Pay, Apple Pay, and PayPal buttons on the PDP collapse mobile checkout to a tap, and accelerated checkouts convert at a published multiple of standard flows; the mechanics are compared in the ECM Shopify tiers guide. If your desktop-to-mobile conversion ratio exceeds ~1.8x, the wallet-and-speed pair is almost always the gap.
-
05Ship the structured-data layer while you're in the template: Product schema with price, availability, ratings, and the shipping/returns fields Google keeps adding to Merchant Center. It's the same single template edit, it feeds rich results and AI answers, and it makes the ratings you just collected visible before the click.
Outsourcing the testing layer?
The ECM directory's CRO category lists conversion specialists with published budgets and verified reviews — matched to the traffic volume and platform your store actually runs.
Sequencing the work: the two-week fixes and the testing threshold
The element data above sorts itself into a sequence. Most stores can ship the first tier in two weeks per template, no agency required.
-
01Tier one, the high-impact fixes (20–40% improvements in the published data): review visibility near the buy button, an in-scale image per product, buy-box clarity on shipping and returns, and the gallery speed pass. All four are template-level changes that touch every SKU at once, which is what makes PDP work compound differently from campaign work.
-
02Tier two, the production investments: product video (30–80%), the UGC collection flow (5–15% contributor rate), and the schema layer. These take weeks, not days, and the review curve says to point them at high-AOV, low-review SKUs first.
-
03Tier three, formal testing — gated by the same math as any CRO program: roughly 1,000 monthly conversions for significance-grade A/B testing. Below the line, ship the published fixes directly and measure before/after per template; above it, test the contested choices (gallery order, buy-box layout, review placement) properly. The readiness thresholds and vetting questions live in the ECM CRO agency guide.
-
04Measure at the right altitude: add-to-cart rate per template (the 5–10% healthy band) is the PDP's own metric, with session conversion and revenue per session as the downstream confirmations. A PDP change judged only on blended site conversion is being judged through three layers of noise — the session-level tables in the ECM conversion benchmarks guide show how much of that blend the PDP never touches.
-
05Re-audit quarterly against the Baymard-style checklist (in-scale image, 5+ photos, video present, reviews answered, LCP under 2.5s, wallets live) because catalogs drift: new SKUs launch with two photos and zero reviews, and the average quietly degrades. ECM tracks the conversion data as it moves in weekly Insights.
What a smart operator does with this
Audit before optimizing, because the bar is lower than the discourse suggests: 62% of mobile PDPs at leading retailers rate mediocre or worse, 37% lack an in-scale image, and 89% leave negative reviews unanswered. Several of the highest-payoff fixes are free, template-level, and shippable in two weeks.
Spend where the curves are steepest. Reviews first — the curve from +18% at five reviews to +270% at scale makes the first fifteen reviews per high-AOV SKU the best collection work in the catalog, fed by post-purchase flows converting 5–15% of customers. Media second: 7+ fast-loading images and a product video (30–80% lift, 4.1x for video reviews), while respecting the image-count ceiling, where photos 9 through 15 can cost more in speed than they earn in persuasion.
Then protect it all with speed and close with the buy box: 0.1 seconds of mobile improvement is worth 8.4% in conversions, LCP belongs under 2.5 seconds, and price-shipping-returns clarity plus express wallets fixes part of the ~70% cart abandonment before the cart exists. Measure at add-to-cart per template, gate formal testing at ~1,000 monthly conversions, and re-audit quarterly, because catalogs drift back toward the Baymard average on their own.
Frequently asked questions
What is the most important element on a product page?
Images are where shoppers start (56% explore product images before anything else, per Baymard), but reviews have the largest measured conversion impact: the Spiegel Research Center ladder runs from +18% with one to five reviews to +270% at 100+, with five reviews making purchase 270% more likely than zero. The practical ranking: get review visibility and a complete, fast-loading image gallery right first, then add video (30–80% lift), then buy-box clarity on price, shipping, and returns. Copy rewrites come last; a page with traffic that doesn't convert usually has a media, speed, or trust gap rather than a copy gap.
How many images should a product page have?
Seven or more, covering angles, texture, in-scale context (the photo 37% of stores are missing), and the product in use — pages with 7+ images, video, and zoom convert 1.6–2.4x better than single-image pages. But quantity has a ceiling: expanding from 8 to 15 images often drops conversion 10–15% because the added load time costs more than the extra photos earn, especially on mobile. The working rule is 7–8 excellent, compressed, lazy-loaded images with the main image hitting LCP under 2.5 seconds on mobile.
Do product videos actually increase conversions?
Yes, across every major dataset: 30–80% conversion lift depending on category and quality, with Ariat reporting video viewers converting 160% higher and Amazon's internal data showing listings with video converting 5–15% better. Video also cuts apparel returns by 11–17% by setting accurate expectations. Customer-shot video punches above studio production for trust: video reviews convert 4.1x better than text-only reviews. Speed isn't a real objection — a properly lazy-loaded product video adds under 100 milliseconds to page load.
How many reviews does a product need?
The curve is steep early and keeps climbing: versus zero reviews, 1–5 reviews lift conversion ~18%, 6–15 lift it ~63%, 16–50 lift it ~174%, 51–100 lift it ~243%, and 100+ reach ~270% (Spiegel Research Center). Around 10 reviews corresponds to a ~45% lift, and each additional 10 reviews adds roughly 10% more. The effect is strongest on higher-priced products, so point collection at high-AOV SKUs first. Post-purchase email flows convert 5–15% of customers into reviewers, and prompting for photos or video matters — photo reviews convert 2.6x and video reviews 4.1x better than text-only.
How much does page speed affect product page conversion?
More than almost any single design choice. A product page loading in 1 second converts around 3.05%, with a 2.5x conversion gap versus a 5-second page (Portent), and Deloitte's retail research found a 0.1-second mobile speed improvement lifted retail conversions 8.4%. The usual offenders on PDPs are uncompressed gallery images (target main-image LCP under 2.5 seconds on mobile), third-party scripts, and ironically the review and UGC widgets added for conversion — which is why gallery changes and app installs should always be measured with speed in the same report.
The playbook top eComm operators actually read
One weekly brief. Five stories that matter. Zero fluff. Written for managers at $5M–$50M DTC brands who want to sound sharper than everyone else in the meeting.
References
- 01 Product Page Optimization: 7 Fixes Most Stores Still Miss in 2026 (Baymard Benchmark) — clariola.com
- 02 Product Page Optimization: A Data-Backed Guide — kirro.io
- 03 E-commerce Conversion & Product Imagery Statistics (2026) — vovv.ai
- 04 Why Your Product Page Needs a Video in 2026 (Conversion Data) — evolveamz.com
- 05 UGC Conversion Rates: Data From 2026 — storecensus.com
- 06 User-Generated Content Statistics: Key Data on UGC Marketing, Trust, and Conversions — salesgenie.com
- 07 45 UGC Statistics for 2026 — pitchbrand.co
- 08 User-Generated Content (UGC) Statistics 2026: 30+ Data Points — easyappsecom.com
- 09 Product Page Optimization: 12 Changes That Increase Conversions — peasy.nu
- 10 Product Page Conversion Rate Optimization in 2026 — vntana.com
- 11 Cart Abandonment Rate Statistics — baymard.com
Make your product pages data-backed
Join 12,000+ ecommerce managers reading the ECM newsletter every Wednesday — or browse the directory to find vetted CRO, migration, and platform specialists.