Last Updated on November 1, 2026
Mobile Conversion Rate in 2026: The Gap, the Flip, and the Money Still on the Table
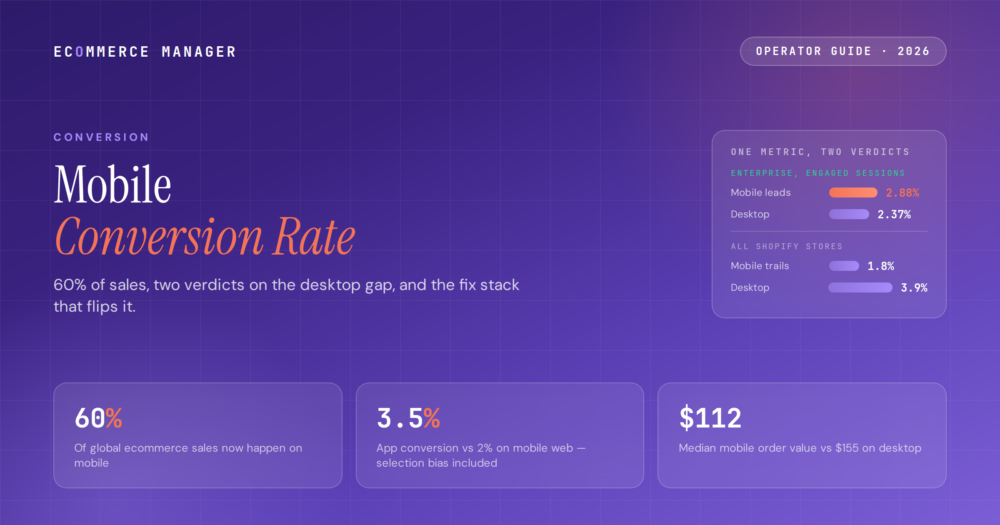
Mobile is 60% of ecommerce sales and converts at 2.9% or 1.8% depending on whose stores you measure — the gap to desktop has flipped in some panels and yawns at 2x in others. Which side your store is on, why the AOV gap survives either way, the app question answered without the vendor math, and the fix stack in payback order.
On this page
Mobile won the traffic war and is still losing the wallet war
The headline numbers for 2026: mobile carries roughly 60% of global ecommerce sales (up from 43% in 2018, headed for 63% by 2028), somewhere between 58% and 72% of traffic depending on the dataset, and about 57% of revenue. Sales share below traffic share, revenue share below both: that ordering is the entire mobile conversion problem in one line, and it persists at $2.4–3.4 trillion of global scale.
The conversion number itself depends on whose stores you measure, the same lesson as every benchmark in this series. Dynamic Yield's rolling 12-month figures have mobile at 2.88%, now ahead of desktop's 2.37%, and real among enterprise retailers measuring engaged sessions. Contentsquare still shows 2% mobile against 3.4% desktop. And all-store Shopify data runs mobile at roughly 1.8% against desktop's 3.9%, a 2x-plus spread. "Mobile matched desktop in 2026" and "desktop converts twice as high" are both currently published, both true, and true of different store populations; your job is knowing which population you're in.
What follows: the source-by-source numbers and the ratio audit that locates your store; the AOV gap that survives even where conversion flips ($91–112 mobile vs $128–155 desktop); the app-versus-mobile-web question answered with the selection bias stated instead of hidden; and the fix stack (wallets, speed, forms) in payback order. The session-level context lives in the ECM conversion benchmarks guide; this piece is the mobile deep-dive it pointed at.
The mobile numbers, source by source
Three credible sources, three different verdicts on the desktop gap. The spread is the finding; locate your store before setting any target.
-
01Dynamic Yield (enterprise, engaged sessions): mobile 2.88%, desktop 2.37%. The flip. Among large retailers that have done the wallet, speed, and checkout work, mobile now out-converts desktop in live rolling data. Tablet sits between at 2.85%. This is what finished mobile optimization produces, which makes it a target rather than a baseline.
-
02Contentsquare (enterprise data, different counting): mobile 2%, desktop 3.4%. Same tier of retailer, different session definitions, opposite verdict: the cleanest possible demonstration that the metric definition decides the story. Never mix panels when trending your own number.
-
03All-store Shopify data: mobile ~1.8%, desktop ~3.9%, with top-quartile mobile web reaching 4.8% and Littledata's top-10% thresholds at 3.9% mobile / 6.5% desktop. The typical unoptimized store still lives with a 2x gap, and the top-quartile line shows the 4%+ mobile web store exists without an app.
-
04The ratio audit from the benchmarks guide, now with source context: desktop converting above ~1.8x your mobile rate means a mobile experience problem, not a traffic problem. Between 1.2x and 1.8x you're typical; at or below 1.2x you've effectively closed the gap and the flip cohort is your new peer group. Compute it monthly, by landing-page template, in your core KPI set.
-
05Share context for the budget conversation: mobile is 63.5% of sales in IRP's June 2026 live benchmark, ~45–50% in the US, 77% in South Korea, and only 12% of shoppers describe mobile web as convenient. The majority surface of ecommerce is also its least-liked, which is the opportunity stated as a complaint.
-
06Category moves mobile too: Food & Beverage converts at 6.11% on mobile, the top of the ladder, with luxury under 1%: the same ~6x category spread as blended conversion. Benchmark mobile within your category, per the category tables.
The AOV gap: what survives after conversion flips
Closing the conversion gap is half the mobile problem. The other half shows up on the order value line, and it changes which metric you manage.
-
01Median mobile AOV runs $91–112 against desktop's $128–155, a 25–35% discount that persists even in datasets where mobile conversion leads. Phones win the quick, low-consideration purchase and still lose the researched basket, which is why revenue share (~57%) trails traffic share even as conversion closes.
-
02The management consequence: revenue per session by device is the metric that sees both gaps at once. A store celebrating its mobile conversion flip while mobile RPS lags 30% is optimizing the ratio and losing the dollars. Track conversion, AOV, and RPS as one device-level row, not three separate charts.
-
03The AOV levers that work on small screens: express-wallet upsells after the first item is secured, free-shipping thresholds visible in the header (the same lever the cart abandonment guide prices against your 3PL economics), one-tap bundle adds on the PDP, and saved carts that let the researched basket start on mobile and finish anywhere.
-
04Repeat customers are the AOV shortcut: repeat-visitor mobile conversion runs 2.9x first-timers, and returning buyers carry bigger baskets. The mobile program and the retention program are the same program wearing two names; the email flows converting at 4%+ land overwhelmingly on phones.
-
05Cross-device candor in attribution: mobile starts purchases desktop finishes. Last-click device reporting undercounts mobile's contribution to desktop orders, so before concluding mobile 'underperforms,' check assisted paths — part of the shortfall is a measurement artifact of people researching on the couch and buying at the desk.
What's your mobile gap worth in dollars?
Run your device split, AOV, and conversion rates through the ECM Platform Calculator — at 70% mobile traffic, a half-point of mobile conversion usually outweighs anything desktop can offer.
The app question, with the selection bias stated
Apps convert at 3.5% against mobile web's 2%, and vendors stop the sentence there. The full sentence is more useful and less flattering.
-
01The published numbers are real: apps convert around 3.5% versus ~2% mobile web, app users view 286% more products per session (22 vs ~6), app AOV runs ~$95 against $73, and 54% of mobile commerce transactions now happen in apps. Merchant-reported app rates run higher still: 5–13% averages with seasonal peaks past 20%, and outliers claiming 22x their mobile web rate.
-
02Now the selection bias: the people who install your app are your best customers pre-selected. Repeat mobile visitors already convert 2.9x first-timers on any surface; the app concentrates existing loyalty as much as it creates conversion. Comparing app users to all mobile web visitors is comparing your VIP list to your traffic; the fair comparison is app users versus your logged-in repeat buyers on mobile web, and that difference is far smaller.
-
03The right reading: an app is a retention asset, not a conversion fix. Push notifications, stored payment, and zero-friction reorder genuinely lift frequency and LTV for customers who already love you. What an app does not do is fix a 2x desktop-to-mobile spread for first-time visitors, who arrive on mobile web regardless, which is why the web fix stack below comes first at every store size.
-
04The thresholds where an app earns its keep: a real repeat-purchase business (subscriptions, consumables, 3+ orders/year cohorts), an owned audience that will install, and mobile web already optimized, because an app bolted onto a broken mobile web experience moves your best customers to a better room while the majority keeps leaving through the same door. The build-versus-buy and platform mechanics belong in your tech stack audit.
-
05If the install case is thin, steal the app's tricks instead: stored payment via wallets, home-screen PWA install, push via web, and logged-in persistence capture most of the app's mechanical advantages at a fraction of the cost, which is exactly what the flip-cohort retailers did to get mobile web past desktop.
What actually moves mobile conversion, in payback order
The flip cohort isn't a mystery — the stores in them did the same four things. Ranked by impact against effort.
-
011. Express wallets everywhere: digital wallets now carry 56% of global ecommerce transaction value. Shop Pay, Apple Pay, and Google Pay collapse the form (mobile's core handicap) to a biometric tap, and accelerated checkouts convert at a published multiple of standard flows. On the PDP and at the top of checkout, not buried at step three; the platform mechanics are compared in the ECM Shopify tiers guide.
-
022. Speed, priced honestly: roughly 7% conversion penalty per second of load time, and Deloitte measured +8.4% retail conversions from 0.1 seconds of mobile improvement. Target LCP under 2.5s on the PDP's hero image, compress the gallery, defer the script pile; the same Core Web Vitals work that governs replatforming SEO outcomes is the mobile conversion program too.
-
033. The checkout form, thumb-first: mobile abandons at ~80% against desktop's 66–67%, and the difference is friction, not intent. Field reduction toward 7–8, address autocomplete, numeric keyboards for numeric fields, visible totals before checkout starts: the full ranked program, with Baymard's 35% checkout-design upside, is in the cart abandonment guide.
-
044. The PDP on a phone: 7–8 fast images, video, review proof above the fold, and in-scale shots: mobile shoppers read galleries, not paragraphs, and the element-level lift data (the review curve to +270%, video's 30–80%) applies hardest on the device where attention is shortest. The sequencing lives in the product page guide.
-
05Verify like the flip stores do: real devices on cellular, not a resized browser, and A/B test the contested choices (wallet placement, form order) once you clear the ~1,000 monthly conversions that make testing statistically valid, per the CRO agency guide's gating math.
Mobile work worth specialist hands?
The ECM directory's CRO category lists conversion and checkout specialists with published budgets and verified client reviews — matched to your platform and traffic volume.
The mobile program: targets, cadence, and the right goal
Pulling it together into something you can run quarterly, with targets set by where the data puts you rather than vendor decks.
-
01Set the target by where you are: above a 1.8x desktop-to-mobile ratio, the goal is reaching 'typical' (1.2–1.8x) via the fix stack; inside the typical band, the goal is parity or better: mobile at or above desktop, which the 2.88%-vs-2.37% cohort proves is achievable, not aspirational. A store at 1.8% mobile reaching the 4.8% top-quartile line roughly doubles the revenue of its largest traffic segment.
-
02Price the move before budgeting it: at 70% mobile traffic, a half-point of mobile conversion is worth more than two points of desktop. Run your own split through the ECM platform calculator; the dollar figure, not the percentage, decides between the two-week wallet project and the two-quarter replatform conversation.
-
03Measure the full device row monthly: conversion, AOV, revenue per session, add-to-cart, and cart-to-checkout, by device, same definitions, same source. The two-gap structure (conversion and AOV) means single-metric mobile reporting always misleads in one direction or the other.
-
04Sequence by quarter: wallets and speed first (weeks), form and PDP work second (a quarter), app or PWA evaluation last and only against the retention thresholds above. Stores run this backwards constantly — commissioning apps while their mobile web LCP sits at 5 seconds — because the app has a vendor pitching it and the speed work doesn't.
-
05Re-benchmark quarterly against the same sources: mobile's numbers are the fastest-moving in ecommerce (the crossover itself is recent), and a static target ages in two quarters. ECM tracks the device data as it moves in weekly Insights.
What a smart operator does with this
Locate yourself before targeting anything. Mobile is 60% of sales and most of your traffic, and its conversion rate is 2.88% (ahead of desktop) in the enterprise flip cohort, 2% (well behind) in others, and ~1.8% against 3.9% in all-store data. Compute your own desktop-to-mobile ratio: above 1.8x is an experience problem, 1.2–1.8x is typical, and at parity you've joined the leaders; each position has a different next project.
Manage both gaps, not one. The conversion gap can close while the AOV shortfall ($91–112 mobile vs $128–155 desktop) stays open, so revenue per session by device is the metric that can't be fooled. Treat the app question with the selection bias stated: 3.5% versus 2% is mostly your best customers pre-selected, an app is a retention asset for repeat-purchase businesses, and a store with unoptimized mobile web should steal the app's tricks (wallets, PWA, web push) before building one.
Then run the fix stack in payback order: express wallets everywhere (56% of global transaction value already runs through them), speed priced at ~7% conversion per second, the thumb-first checkout against mobile's ~80% abandonment, and the PDP's gallery-reviews-video work. Verify on real devices over cellular, test properly past ~1,000 monthly conversions, and re-check the sources quarterly — the crossover happened fast, and the next move will too.
Frequently asked questions
What is the average mobile conversion rate in 2026?
It depends on the dataset, and the spread is the real answer. Dynamic Yield's rolling 12-month enterprise benchmark puts mobile at 2.88% — now ahead of desktop's 2.37%. Contentsquare's separate enterprise dataset shows 2% mobile against 3.4% desktop. All-store Shopify data runs mobile around 1.8% versus desktop's 3.9%, with top-quartile mobile web reaching 4.8%. For an established DTC store, 2–2.5% mobile is a fair baseline, 3%+ is strong, and parity with your own desktop rate is the meaningful milestone — the enterprise flip proves it's achievable.
Why is mobile conversion lower than desktop?
Where it's still lower (most stores), the causes are mechanical: forms punish thumbs, cost information surfaces later on small screens, pages load slower on cellular, and interruptions break sessions — which is why mobile cart abandonment runs ~80% against 66–67% on desktop. Intent isn't the explanation; the same shoppers complete on desktop, and enterprise retailers that finished the wallet, speed, and checkout work now see mobile convert ABOVE desktop (2.88% vs 2.37% in Dynamic Yield's data). Part of the remaining difference is also measurement: mobile starts purchases that desktop finishes, and last-click reporting credits the finish line.
Do mobile apps convert better than mobile websites?
The published gap is real — apps convert around 3.5% versus ~2% on mobile web, app users view 286% more products per session, app AOV runs ~$95 versus $73, and 54% of mobile commerce transactions now happen in apps — but it's heavily selection-biased: people who install your app are your best customers pre-selected, and repeat mobile visitors already convert 2.9x first-timers on any surface. An app is a retention asset for repeat-purchase businesses (subscriptions, consumables, high-frequency cohorts) with an audience that will install it. It doesn't fix mobile web for first-time visitors, who arrive there regardless — wallets, PWA install, and web push capture most of the app's mechanics first.
How do I improve my mobile conversion rate?
In payback order: add express wallets (Shop Pay, Apple Pay, Google Pay) on the PDP and at the top of checkout — digital wallets already carry 56% of global ecommerce transaction value, and they collapse mobile's form problem to a biometric tap. Fix speed: roughly 7% conversion penalty per second, +8.4% measured from 0.1 seconds of mobile improvement (Deloitte), LCP under 2.5s on product pages. Rebuild the checkout thumb-first: 7–8 fields with autocomplete, numeric keyboards, totals visible early, against mobile's ~80% cart abandonment. Then do the PDP media and review work, verify on real devices over cellular, and A/B test placement choices once you clear ~1,000 monthly conversions.
What share of ecommerce is mobile in 2026?
Roughly 60% of global ecommerce sales, up from 43% in 2018 and projected to reach 63% by 2028, worth $2.4–3.4 trillion depending on the forecast. Traffic share runs higher, about 58–72% depending on the source, while revenue share sits near 57%, reflecting mobile's lower average order values ($91–112 versus $128–155 on desktop). Regionally: around 45–50% of US online sales, 55%+ in the UK, 77% in South Korea, and 63.5% of sales in IRP Commerce's June 2026 live benchmark. The ordering (traffic above sales above revenue) is the mobile opportunity in one line.
The playbook top eComm operators actually read
One weekly brief. Five stories that matter. Zero fluff. Written for managers at $5M–$50M DTC brands who want to sound sharper than everyone else in the meeting.
References
- 01 40+ Mobile Commerce Statistics (2026): Sales, Trends, and Market Data — mobiloud.com
- 02 42 Mobile Commerce Statistics You Need to Know in 2026 — ringly.io
- 03 Mobile Commerce: 55+ Statistics for 2026 — vovv.ai
- 04 Mobile Commerce Statistics 2026: 25+ Numbers Every Ecommerce Brand Needs — firework.com
- 05 eCommerce & Shopify Average Conversion Rate Benchmarks 2026 — blendcommerce.com
- 06 Mobile Ecommerce Statistics 2026: M-Commerce Sales, Conversion and Checkout Trends — quashbugs.com
- 07 What Is a Good Mobile eCommerce Conversion Rate in 2026? — skailama.com
- 08 Mobile Commerce Statistics 2026: Market Data Complete Guide — axis-intelligence.com
- 09 Ecommerce Conversion Rate Optimization 2026: 50+ Benchmarks & Strategies — dollarpocket.com
- 10 50 Cart Abandonment Rate Statistics — baymard.com
- 11 Milliseconds Make Millions — deloitte.com
Make your mobile strategy data-backed
Join 12,000+ ecommerce managers reading the ECM newsletter every Wednesday — or browse the directory to find vetted CRO, migration, and platform specialists.