

Last Updated on October 27, 2026
Cart Abandonment Rate in 2026: The Benchmarks, the Floor, and What Actually Recovers Revenue
The average is 70.22% and has barely moved in a decade — because the realistic floor is 55–60%. Where the leak actually sits in the funnel, the ranked reasons shoppers leave, the checkout fixes with the biggest paybacks, and recovery benchmarks with their denominators attached.
On this page
Seventy percent of carts die — and a third of those deaths are preventable
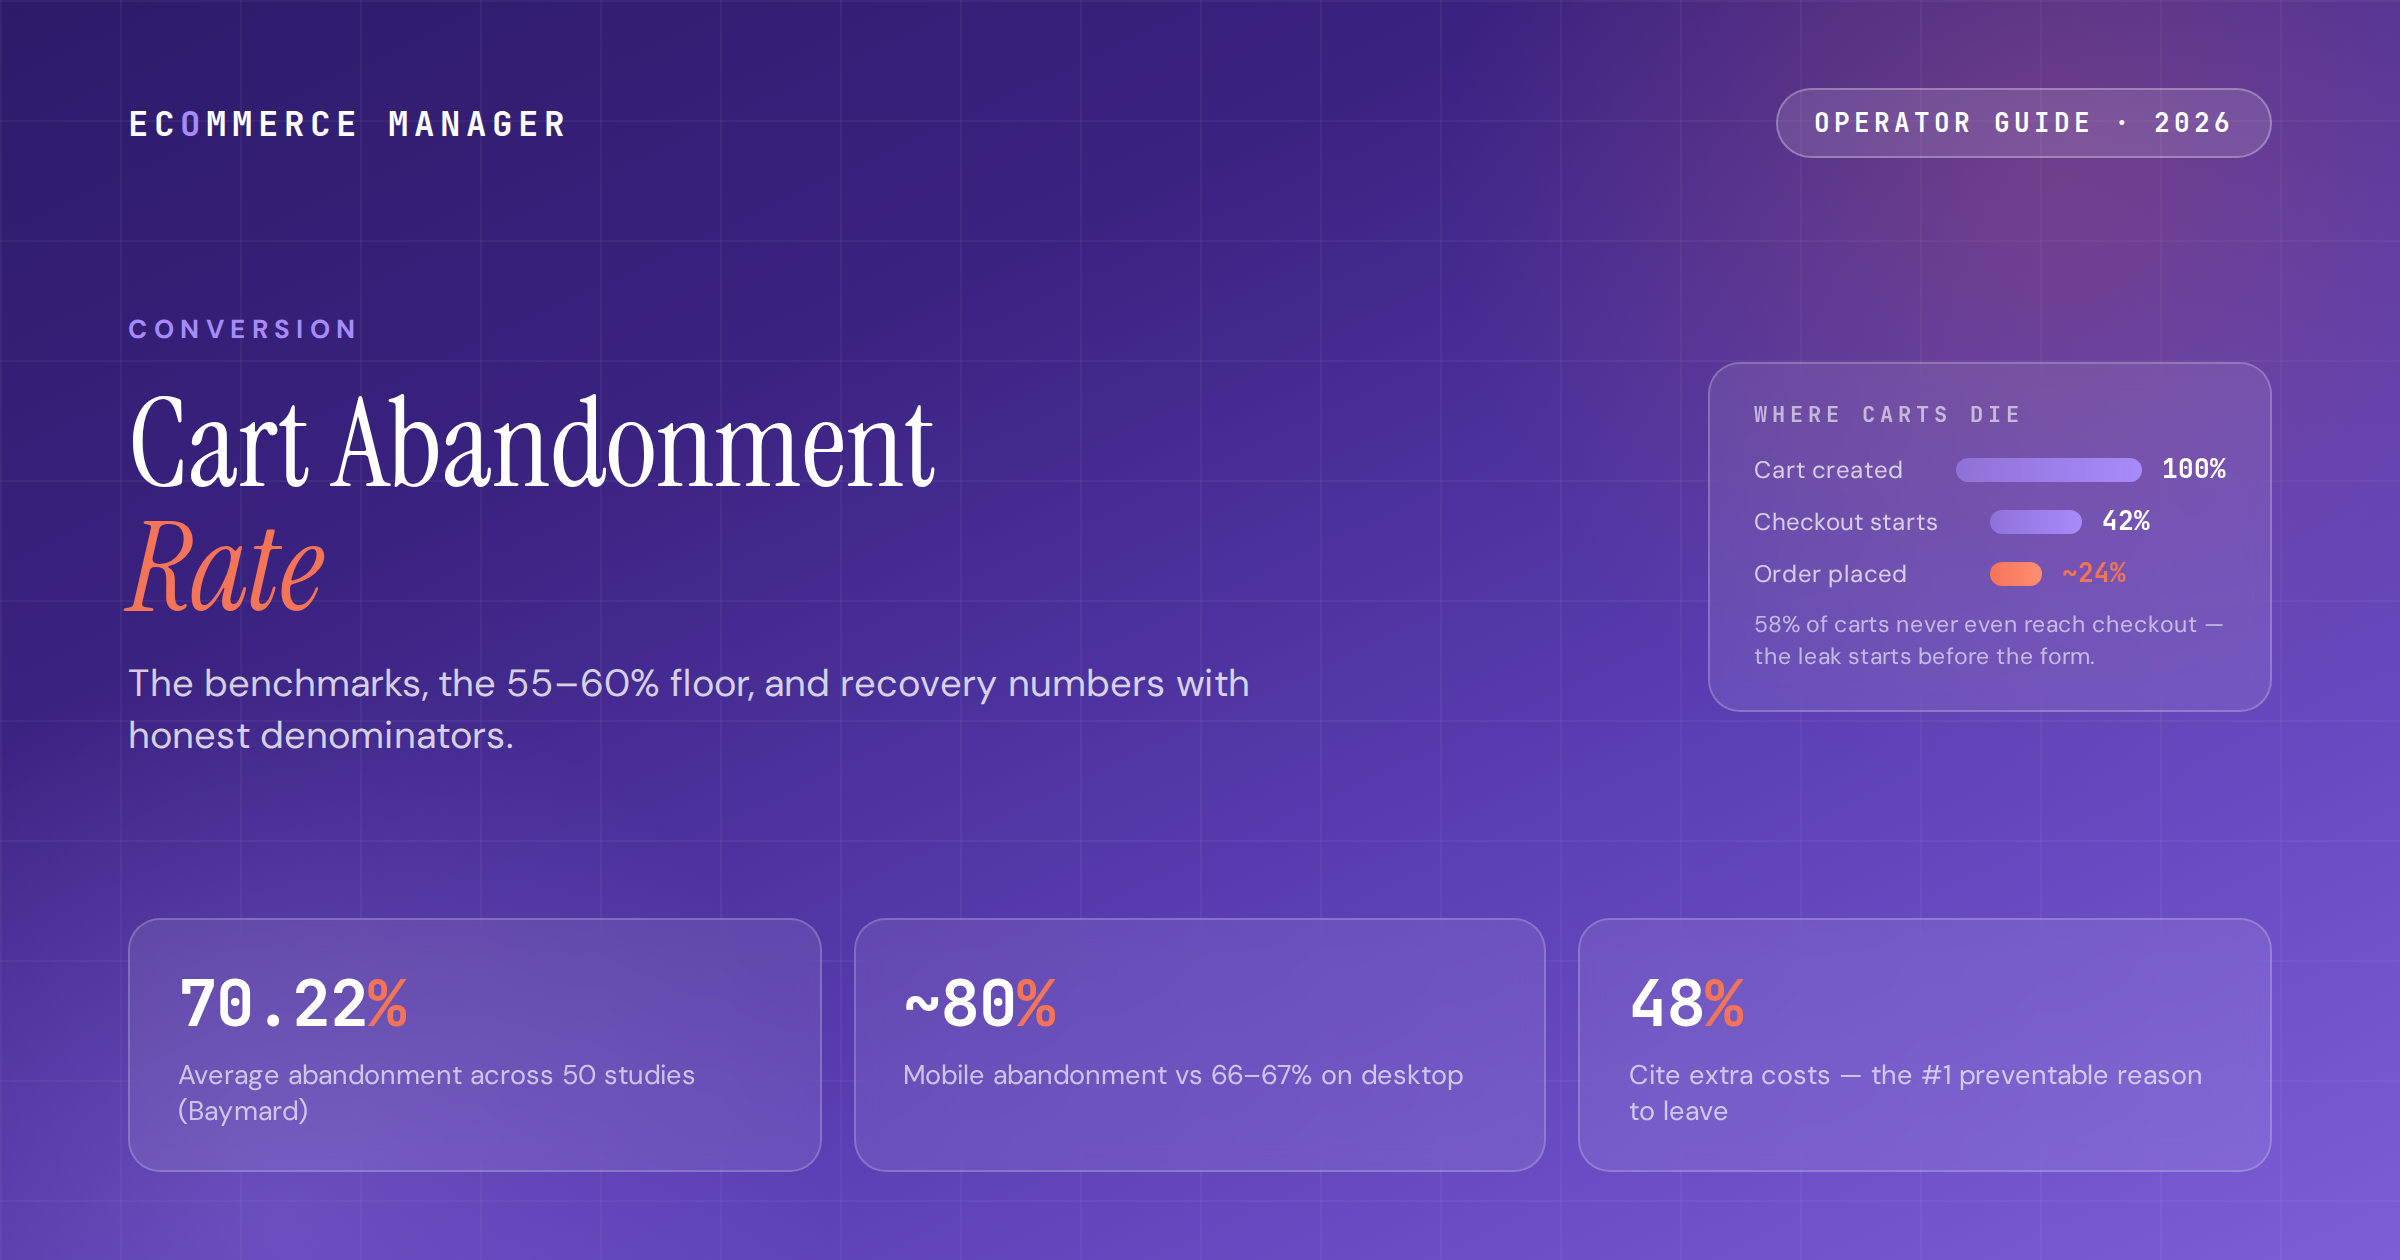
The average documented cart abandonment rate is 70.22%, from Baymard Institute's meta-analysis of 50 independent studies, and the live panels run hotter: Dynamic Yield's 400+ brand benchmark logged 77.38% worldwide for October 2025 through September 2026, and a measured Shopify-only dataset ran 76.04% in the first half of 2026. The sheer stability is the first lesson: the rate has sat between 68% and 71% for a decade despite enormous checkout UX improvement, because a large share of cart additions were never purchase attempts. In Baymard's 2026 survey of 1,083 US shoppers, 42% named "just browsing" as a reason they abandoned.
That's why the most useful number in the dataset isn't the average; it's the floor. Baymard puts the realistic minimum for a fully optimized checkout at roughly 55–60%, because comparison shopping and tab-parking can't be designed away. The operator's target is the 10-to-15-point gap between the average and the floor, and the money inside it is real: an estimated $260 billion in recoverable orders across US and EU retail, lost mostly to causes shoppers name explicitly and stores can fix directly.
This guide works the problem in that order: where the leak actually sits in the funnel (mostly before checkout even starts), why shoppers say they leave (the top three reasons are all preventable), the checkout fixes ranked by payback, and recovery benchmarks with their counting made explicit, because "recovers 35% of carts" and "recovers 3% of carts" are both published numbers, and both are true of different fractions.
The 2026 numbers, and the floor that reframes them
Three credible averages, one structural floor, and the device gap that explains most of the variance between stores.
-
01The meta-average: 70.22% across 50 documented studies (Baymard, updated September 2025), the citation-grade number, representing long-run cross-industry reality. The live panels run higher: Dynamic Yield's 77.38% across 400+ brands (Oct 2025–Sep 2026) and a Shopify-measured 76.04% (Jan–Jun 2026, 1-hour abandonment window). If your analytics show 74–78%, you're normal, not broken.
-
02The decade view: 68–71% the entire time. Checkout UX has improved massively since 2015 and the average barely moved, because abandonment is partly shopping behavior rather than purely friction. Carts are wishlists, price calculators, and shipping-cost probes, which is also why the metric only becomes meaningful next to its neighbors in your core KPI set: add-to-cart rate, checkout completion, and revenue per session.
-
03The floor: ~55–60% for a fully optimized checkout. Baymard's estimate of the irreducible minimum, since browsing intent can't be eliminated. The practical reading: your opportunity is the distance between your rate and roughly 60%, not the distance to zero: a store at 76% has ~16 points of fixable loss, which is the right frame for every investment below.
-
04The device gap is the single biggest predictor: mobile abandons at ~80% (Baymard 80.02%, Dynamic Yield 80.45% live) versus 66–67% on desktop, with tablets near 70%. Mobile carries roughly three-quarters of traffic, so the blended rate is mostly a mobile story, and the 12-to-15-point spread is friction, not intent, because the same shoppers complete on desktop.
-
05Industry moves the baseline too: fashion runs to 84.6% and luxury/jewelry 81.7% at the high end, tracking high-consideration browsing and sizing risk. Benchmark within your category the same way the conversion benchmarks guide prescribes for session conversion; the global average flatters some categories and slanders others.
-
06The scale of the prize, for the budget conversation: $260 billion in recoverable US/EU orders, against trillions in gross abandoned value globally. Recoverable is the operative word: it counts the preventable share, not the browsers.
The funnel split most abandonment advice gets backwards
The standard playbook attacks the checkout form. The measured funnel says the bigger loss happens one step earlier.
-
01In measured Shopify data, 58% of shoppers who create a cart never start checkout at all. The cart-to-checkout transition, not the checkout form, is where the majority of abandonment actually occurs. These shoppers hit the cart page, saw the subtotal or went looking for the shipping answer, and left before any form existed to optimize.
-
02Of those who do start checkout, 43% don't finish (Baymard's US figure matches at 43% checkout abandonment). This is the population your form-field and payment work addresses — real and worth fixing, but the second-largest hole, not the first.
-
03The split assigns the work: cart-stage losses are information problems, checkout-stage losses are friction problems. Cart-stage fixes are shipping-cost visibility before the cart (thresholds in the header, estimates on the PDP), stock and delivery-date honesty, and a cart page that answers cost questions instead of hiding them behind 'continue.' The PDP-side version of this transparency is the buy-box work in the ECM product page guide. Checkout-stage fixes are the form, account, and payment work in the next sections.
-
04Diagnose before prescribing: pull your own two-stage split (carts created → checkouts started → orders) by device. A store losing 60%+ at cart-to-checkout has a pricing-transparency problem no one-page checkout will touch; a store losing most at checkout has the classic friction profile. The same altitude discipline as PDP work: the product page guide measures at add-to-cart, this metric measures what happens after it.
-
05The mobile version of the split is worse at both stages, which is why the ~80% mobile rate exists: smaller screens hide cost information earlier, and forms punish thumbs harder. Every fix in this guide should ship mobile-first and be verified on a real device, not a resized browser window — with page speed in the report, per the tech stack audit discipline on measurement apps.
What's your abandonment gap worth in dollars?
Run your traffic, AOV, and conversion numbers through the ECM Platform Calculator to price the gap between your rate and the 55–60% minimum — the dollar figure sets the fix budget.
The ranked reasons, from Baymard's 2026 survey
Baymard asked 1,083 US online shoppers why they abandoned. The ranking has been stable for years, and the top of it is a to-do list, not a mystery.
-
01Just browsing / not ready to buy: ~42–43%. The unpreventable share, and the reason the floor exists. Don't spend checkout-optimization money on this group; spend retention and recovery money (the flows in the last section) on staying present until they're ready.
-
02Extra costs too high (shipping, tax, fees): 39–48% depending on survey wave, the #1 preventable reason in every wave. The fix is disclosure timing as much as price: shipping costs surfaced on the PDP and cart page, not at step three. Free-shipping thresholds are the classic lever, and your 3PL economics decide what threshold is survivable; the per-order math lives in the ECM 3PL cost guide.
-
03Forced account creation: 26%. A quarter of abandoners cite the account wall, and the fix costs nothing: guest checkout, with account creation offered after the order confirmation, when the shopper's work is already done. This is the highest ratio of impact-to-effort on the entire list.
-
04Checkout too long or complicated: 22%. The average checkout still carries 11.3 form fields; Baymard's research puts the ideal closer to 7–8, and field reduction plus autofill support is the core of the 20–60% improvement range cut checkouts post. Every field is a question, and every question is an exit.
-
05The rest of the ranked list (couldn't see total cost upfront, site errors, delivery too slow, payment security doubts, no preferred payment method, unsatisfying returns policy) each sits in the 10–25% band, and each maps to one owner: transparency (totals, delivery dates), reliability (errors, speed), and trust (badges, policies, payment options). The top three alone (costs, accounts, complexity) are all preventable, which is Baymard's own headline finding.
The checkout fixes, ranked by payback
Baymard's long-standing estimate: the average large site can gain 35% in checkout conversion through design fixes alone. Here's the order to take them in.
-
011. Kill cost surprise before the cart. Shipping estimates on the PDP, a free-shipping threshold in the header, tax and total visible in the cart: this attacks the 39–48% reason and the 58% cart-to-checkout dropout at once, which makes it the highest-payback item despite being the least glamorous.
-
022. Guest checkout, account later. Retires the 26% account-wall reason in an afternoon of configuration on most platforms.
-
033. Cut the form from 11.3 fields toward 7–8: single name field, address autocomplete, optional phone, no repeat entries; the 20–60% abandonment-reduction range for streamlined checkouts lives mostly in this work plus step consolidation (a complicated checkout is the stated reason for 22%).
-
044. Express wallets at the top of checkout, and on the PDP. Shop Pay, Apple Pay, and PayPal collapse the mobile form problem entirely for returning wallet users, which is why they attack the ~80% mobile rate hardest; accelerated checkouts convert at a published multiple of standard flows, and the platform mechanics are compared in the ECM Shopify tiers guide.
-
055. Trust and recovery furniture: visible security badges, clear returns in one line, saved-cart persistence, and error states that don't wipe the form. Each addresses a 10–25% reason; together they're the difference between a checkout that tolerates a connection hiccup and one that converts it into an abandonment statistic.
-
06Then verify by the split, not vibes: re-measure carts → checkouts → orders by device after each fix ships. For stores above ~1,000 monthly conversions, the contested choices (step count, field order, wallet placement) are A/B-testable with real significance — the gating math and agency-vetting questions are in the ECM CRO agency guide.
Checkout work worth specialist hands?
The ECM directory's CRO category lists conversion and checkout specialists with published budgets and verified client reviews — matched to your platform and traffic volume.
Recovery benchmarks, with the denominators attached
Recovery claims range from 3% to 38% in published 2026 data, and all of them are 'true' — of different fractions. Here's the table with the counting made explicit.
-
01Abandonment emails open at ~44.7%, the highest-opening automated email in ecommerce, and convert around 10.7% of recipients. Measured against all abandoned carts, classic email recovery lands at 3–5% (Klaviyo's benchmark: 3.33%). Both numbers describe the same flow; the denominator is the difference, and it's the first question to ask of any vendor's recovery claim.
-
02Timing concentrates the value: the first email, sent within a 4-hour window, drives about 60% of all recovered revenue, and multi-touch sequences (three messages beats one) recover 25–35% in the most favorable counting: engaged, reachable abandoners. The operational translation: the first message's speed matters more than the third message's discount.
-
03Match the message to the abandoner: high-intent checkout abandoners recover at 10–20% when contacted within the hour, while price-checkers (the 75–85%-abandoning comparison shoppers) convert at 3–6% and mostly on a threshold or offer. Segmenting by how far they got, cart page versus payment step, is the cheapest personalization with measured payback.
-
04The newer channels trade reach for intimacy: SMS and WhatsApp post 95–98% open rates, with WhatsApp recovery reported at 12–40% (two-way conversation resolves the objection in-thread), and AI-powered pre-abandonment intervention claims up to 38%: the widest-ranging and least-standardized numbers in the set, worth piloting with your own split-out counting rather than the vendor's.
-
05Cap the program with the discount discipline: recovery flows train deal-waiting if every email carries 10% off. Sequence it: reminder first, objection-handling second (shipping answer, the review proof, returns line), incentive last and only for carts above a value cutoff. The browsers from the 42% will take the discount they never needed; the sequence exists to avoid paying them for it. ECM tracks how recovery economics shift in weekly Insights.
What a smart operator does with this
Reframe the target. The average is 70.22% and the floor is 55–60%, so the job is closing your store's gap to that minimum, not chasing zero — and if your blended rate sits at 74–78%, you match the live panels, with roughly 15 points of fixable loss. Most of that loss happens earlier than the advice assumes: in measured data, 58% of cart creators never start checkout, which makes cost transparency at the PDP and cart stage the first project, not the form.
Work the ranked reasons in payback order: surface shipping costs early (the 39–48% reason), ship guest checkout (26%, nearly free), cut the form from 11.3 fields toward 7–8 (22%, with 20–60% improvement ranges for streamlined checkouts), and put express wallets on top — mobile's ~80% rate against desktop's 66–67% is friction, and wallets delete most of it for returning users. Baymard's 35% checkout-conversion upside from design alone is the budget justification in one number.
Then run recovery with honest denominators: emails open at 44.7% and convert ~10.7% of recipients, which is 3–5% of all abandoned carts; the first message inside 4 hours carries ~60% of recovered revenue; high-intent abandoners recover at 10–20% within the hour while price-checkers need a reason. Sequence reminder → objection → incentive, put a value cutoff under the discounts, and measure every channel against the same denominator — recovered ÷ all abandoned — so a 38% vendor claim and your 4% reality can finally have the same conversation.
Frequently asked questions
What is the average cart abandonment rate in 2026?
The average documented rate is 70.22%, from Baymard Institute's meta-analysis of 50 independent studies — a figure that has stayed between 68% and 71% for a decade. Live benchmarks run higher: Dynamic Yield's panel of 400+ brands measured 77.38% worldwide from October 2025 through September 2026, and measured Shopify-only data showed 76.04% in the first half of 2026. A store seeing 74–78% is typical. The more useful reference is Baymard's realistic minimum of roughly 55–60% for a fully optimized checkout, since browsing behavior can't be eliminated — your opportunity is the gap between your rate and that line.
Why do shoppers abandon their carts?
In Baymard's 2026 survey of 1,083 US shoppers, the leading reason is being not ready to buy — about 42–43% were just browsing, which is the unpreventable share. Among preventable reasons, extra costs (shipping, taxes, fees) lead at 39–48% depending on survey wave, followed by forced account creation at 26% and a checkout that's too long or complicated at 22%. Further down: not being able to see the total cost upfront, site errors, slow delivery, payment security doubts, missing payment methods, and unsatisfying returns policies, each in the 10–25% band. Baymard's own headline: the top three preventable reasons are all directly fixable.
Why is mobile cart abandonment so much higher?
Mobile abandons at roughly 80% (Baymard 80.02%, Dynamic Yield 80.45% in live data) against 66–67% on desktop — a 12-to-15-point gap on the device carrying about three-quarters of ecommerce traffic. The gap is friction rather than intent: smaller screens surface cost information later, forms punish typing, and interruptions break sessions mid-checkout. The fixes that close it are express wallets (Shop Pay, Apple Pay, PayPal collapse the form entirely for returning users), aggressive field reduction with autocomplete, cost transparency before checkout, and saved-cart persistence so an interrupted session resumes instead of restarting.
What percentage of abandoned carts can be recovered?
It depends entirely on what you divide by, which is why published claims range from 3% to 38%. Measured against all abandoned carts, classic email recovery lands at 3–5% (Klaviyo benchmark: 3.33%) — though abandonment emails open at ~44.7% and convert around 10.7% of recipients. Multi-touch sequences recover 25–35% of engaged, reachable abandoners, with the first email inside a 4-hour window driving about 60% of recovered revenue. High-intent checkout abandoners recover at 10–20% when contacted within the hour; comparison shoppers convert at 3–6%, usually needing an offer. WhatsApp reports 12–40% with 95–98% open rates. Always normalize vendor claims to recovered ÷ all abandoned before comparing.
How do I reduce my cart abandonment rate?
In payback order: first, kill cost surprise before checkout — shipping estimates on product pages, a free-shipping threshold in the header, full totals in the cart — because extra costs are the top preventable reason (39–48%) and, in measured data, 58% of cart creators never even start checkout. Second, enable guest checkout (removes the 26% account-wall reason at near-zero cost). Third, cut the form from the 11.3-field average toward 7–8 fields with autocomplete; streamlined checkouts post 20–60% abandonment reductions. Fourth, add express wallets at the top of checkout and on the PDP to attack the ~80% mobile rate. Then re-measure your carts → checkouts → orders split by device after each change, and A/B test the contested choices if you clear roughly 1,000 monthly conversions.
The playbook top eComm operators actually read
One weekly brief. Five stories that matter. Zero fluff. Written for managers at $5M–$50M DTC brands who want to sound sharper than everyone else in the meeting.
References
- 01 50 Cart Abandonment Rate Statistics — baymard.com
- 02 Cart Abandonment Statistics (2026): Rates by Device, Industry and Reason — bestaiansweringservices.com
- 03 Cart Abandonment Benchmarks and Causes: The 2026 Data Guide — zipchat.ai
- 04 Cart Abandonment Statistics 2026: Real Data & Industry Benchmarks — growthsuite.net
- 05 Cart Abandonment Statistics 2026 — searchlab.nl
- 06 Cart Abandonment Rate 2026: Benchmarks, Causes, and How to Recover Lost Revenue — clickpost.ai
- 07 The Cart Abandonment Statistics Every Ecommerce Team Needs — contentsquare.com
- 08 Abandoned Cart Recovery Statistics: 2026 Benchmarks Guide — cartwhisper.com
- 09 Cart Abandonment Statistics for 2026 — popupsmart.com
- 10 Cart Abandonment Rate 2026: Industry & Device Data — zerocartai.com
- 11 Checkout UX: Pitfalls and Best Practices — baymard.com
Make your checkout decisions data-backed
Join 12,000+ ecommerce managers reading the ECM newsletter every Wednesday — or browse the directory to find vetted CRO, migration, and platform specialists.