

Last Updated on June 3, 2026
ABC Inventory Analysis: Complete Guide and Strategies
A team of data science PhDs with 400 features, XGBoost and LightGBM, and full-stack engineering support. Eighty thousand SKUs. Their forecast is wrong, on average, 45% of the time.
That is the ceiling. Last week I sat in on the hackathon where they were trying to push that number down. If a brand running that kind of horsepower can’t get inventory forecasting right, you have to ask what the spreadsheet your planner is updating on Friday afternoons is actually doing.
The State of eCommerce in 2026
This is an article about ABC inventory analysis. Most eCommerce brands I work with are still running it like it’s 2005. Rank SKUs by revenue, label them A/B/C, tell the warehouse to “watch the A’s.” Then they wonder why their working capital is locked in the wrong SKUs while they stock out of the ones that fund the business.
What follows is the version of ABC I actually use with clients running $20M to $250M in revenue. Not the textbook. What’s left after the textbook gets beaten up by reality.
The Complete 2025 E-commerce Manager Career Guide: From Entry-Level to Executive
What the classic framework gets wrong
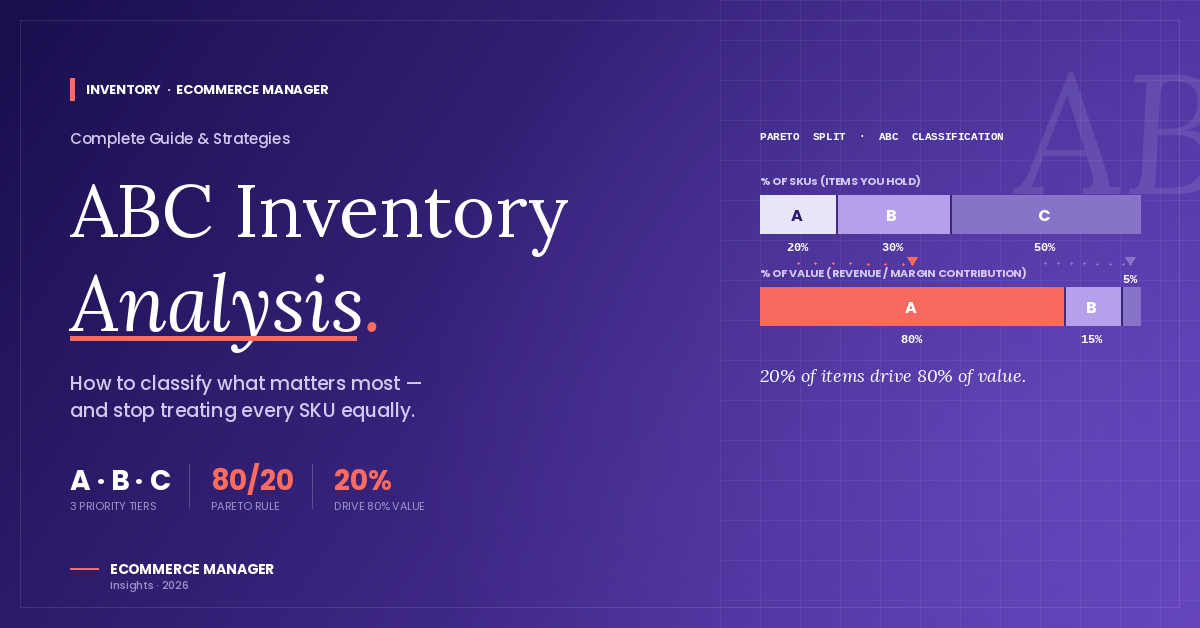
The classic ABC: roughly 20% of your SKUs drive 80% of revenue (A), 30% drive 15% (B), 50% drive 5% (C). Manage A’s tight, B’s pragmatically, let C’s coast.
Practitioners have known for two decades that this needs a second axis. The formal version is ABC-XYZ: ABC by value, XYZ by demand variability. What I walk you through here is the same shape with one extra axis tuned for eCommerce reality. Not enough brands know about ABC-XYZ, and even fewer integrate cash velocity.
Here is where the standard version breaks.
Revenue is the wrong axis. An A by revenue can be a C by contribution margin. I had a client whose top Amazon SKU was carrying a 28% TACOS. A winner by revenue rank, a borderline loser by margin. Product cost $1.75, shipping a dollar, discounts and ad spend eating the rest. Rank by revenue, restock into oblivion.
Marketing Calendar: A Complete Guide
The list goes stale. Most brands refresh once a quarter at best. Meanwhile A’s drop out of the A list and C’s are silently subsidised by A’s.
C’s cost more than the framework admits. Carrying thousands of C SKUs to capture 5% of revenue isn’t passive. It’s working capital, warehouse slots, system complexity, forecast load, obsolescence reserve. None of that shows up on the P&L. All of it shows up on the cash flow statement.
Demand variability is missing. Two A SKUs with identical revenue can have wildly different forecast variability. The one with 20% coefficient of variation is a working-capital asset. The one at 80% CV is a working-capital risk.
Cash velocity is missing. Two A’s can have identical contribution margins and wildly different cash-to-cash cycles. The one with 90-day supplier terms and 14-day cash conversion is functionally a much better A than the one with 30-day deposits and 75-day cycles.
The State of eCommerce in 2025!
The three-axis rank I use
Forget the single A/B/C label. Rank SKUs on three axes.
Axis 1. Contribution margin dollars. Not revenue. After landed cost, allocated ad spend, return rate, platform fees. This is the dollar the business actually keeps.
Axis 2. Cash velocity. I use cash-to-cash days as the cleanest proxy: days of inventory plus days of receivables minus days of payables. At the SKU level where possible, at the supplier level where it has to be. GMROI works as an alternative if you can’t get to SKU-level cash math.
Axis 3. Forecast confidence. Practitioners, this is your XYZ axis. Use coefficient of variation on weekly demand, or hold-out WAPE if you have a model. Don’t rely on a blended MAPE. It blows up on low-volume SKUs and hides bias. Segment accuracy by velocity decile and track bias separately.
The matrix that comes out is more useful than 80/20.
A+. High margin dollars, high cash velocity, high forecast confidence. Protect at all costs, 98%+ service level target, never stock out, push forecast accuracy from good to great because the dollars compound fast.
A-. High margin but low confidence (X-by-margin, Z-by-variability). These are the SKUs that justify the modeling investment. This is where attribute-based forecasting and pipeline signals pay for themselves. Set a slightly lower service level (95% to 97%) and size safety stock against the variability, not against the mean.
B. Decent across the board. Run lean. Don’t overthink it. 92% to 95% service level.
C. Low margin and/or low velocity. The rationalization pile. Most brands have more C SKUs than they admit and culling them is the single highest-ROI inventory move available.
One exception worth naming: ride-along SKUs. If a C is sharing a PO or container with an A+, the marginal freight cost is near zero and the joint replenishment economics flip the decision. Cull the C only if its all-in carrying cost (slot, capital, obsolescence) is greater than the lift it gives the A+’s container math. Most are still worth cutting. Some aren’t.
The connecting logic. Axis 3 (forecast confidence) drives your safety stock and service level targets. Axis 2 (cash velocity) drives where you accept stock-outs versus where you hold buffer. Axis 1 (margin dollars) is the prize the other two protect. If you only remember one thing: forecast confidence sizes safety stock, and safety stock is where most of your cash is hiding.
The part nobody wants to hear: SKU rationalization
In most engagements, the first three-axis analysis ends with the same recommendation. Cut 20% to 40% of your SKUs. Not slow-walk. Cut.
The pushback is always the same. “That SKU has fans.” “We’re about to relaunch it.” “Marketing wants to keep it.”
The math doesn’t care. Nothing else in inventory frees up cash faster. Nothing.
How to do it without blowing up the business.
- Identify the cull list. Bottom 20% to 30% by combined axis rank.
-
Check the constraints. Supplier MOQs, container economics, contractual obligations to retailers, free-riders that ship with A’s at zero marginal cost.
-
Run-out, don’t liquidate, where you can. Stop POs, let demand drain the stock.
-
Liquidate the residual at known cost. The carrying cost of holding it forever is almost always higher than the markdown.
-
Lock the SKU list. Add gating logic: a new SKU only enters the assortment if it displaces a C.
The brands that take this seriously free up serious working capital. The brands that don’t end up with millions sitting in stale inventory because nobody wanted to have a hard conversation about a SKU with fans.
The forecasting upgrade
ABC is only useful if you have a forecast. Most brands at $20M to $50M don’t. They have last-year-plus-a-percentage. That isn’t a forecast. It’s a wish.
Above $50M the forecasting conversation gets serious. The hackathon I opened with, 80,000 SKUs, attribute matrices, XGBoost, LightGBM, 400 features, hundreds of attributes from style and colour to fabric and silhouette, that’s what serious looks like. And the team still has work to do, because a single blended MAPE is the wrong metric and they know it. Practitioners track WAPE, bias by velocity decile, and accuracy versus stockout cost separately.
For most readers of this article, that level is overkill. Here is the principle that transfers down. A forecast that uses pipeline signals (real demand inputs like promo calendars, wholesale commits, B2B order timing, retail orders) beats a forecast that uses only history. Every time.
If you are at $20M and you run a historical-only forecast, the highest-leverage move this quarter is to bolt pipeline data onto your top 50 SKUs. Don’t try to do 4,000. Do 50.
The monthly review (call it S&OP if you want, but do the work)
The three-axis framework cannot force cross-functional alignment on its own. The ranking lives in a spreadsheet on the finance team’s drive while marketing plans a 40%-off promo on a C, ops reorganizes the warehouse without consulting the rank, and the founder browses TikTok for new products to launch.
A real S&OP cycle is five steps over a month: product review, demand review, supply review, financial reconciliation, exec sign-off. Most of my clients do not need full-stack S&OP. What they do need is a monthly inventory review that hits the four decisions that matter.
- Which A+’s are we doubling down on (marketing spend, inventory commit, supplier terms)?
-
Which B’s are getting tested up to A or down to C?
-
Which C’s are being culled this quarter?
-
What is the cash impact of these decisions, and which constraints (MOQs, lead time variability, container loading) override the math?
The brands that run this cadence monthly without fail free up cash. The brands that run it once and forget are still wondering where their cash went.
The AI angle
At EightX we’ve built Claude tools that do a first-pass three-axis ABC in 20 minutes. It used to take an analyst two weeks. The speed isn’t the point.
The point is the AI catches the SKUs humans miss. The C that’s actually a stealth A because it ships with the A’s at zero marginal freight cost. The A that’s actually a C because returns are 35% but the dashboard rolls returns into a different bucket. Humans don’t have time to check every SKU’s full economics. The model does.
If you are running ABC by hand in 2026, you are doing it the slow way.
Monday morning
One thing. Re-rank your top 200 SKUs by contribution margin dollars instead of revenue. The delta between those two lists tells you most of what you need to know.
Five things.
- Pull a 90-day SKU-level P&L. Include allocated ad spend and returns.
-
Rank by contribution margin dollars. Layer on cash velocity (days of inventory as a starting proxy). Layer on demand variability (coefficient of variation on weekly demand).
-
Identify the bottom 20% by combined rank. That is your rationalization list.
-
Add pipeline signals (promo calendar, wholesale orders, paid media plan) to the forecast for the top 50 SKUs only.
-
Put a monthly inventory review on the calendar. Finance, marketing, ops, the CEO. The three-axis ranking is the agenda. Make decisions. Repeat.
That’s the article. The framework is older than I am. The way most brands run it is broken. The version that works is more demanding and more honest about where the money lives.
Remember the team at the top. The data science PhDs, 400 features, 45% MAPE. They know exactly where their money is and they still have work to do. If you don’t know where yours is, that’s the work.
If your version of ABC analysis hasn’t told you something uncomfortable in the last 90 days, it isn’t doing its job.