
Last Updated on June 17, 2026
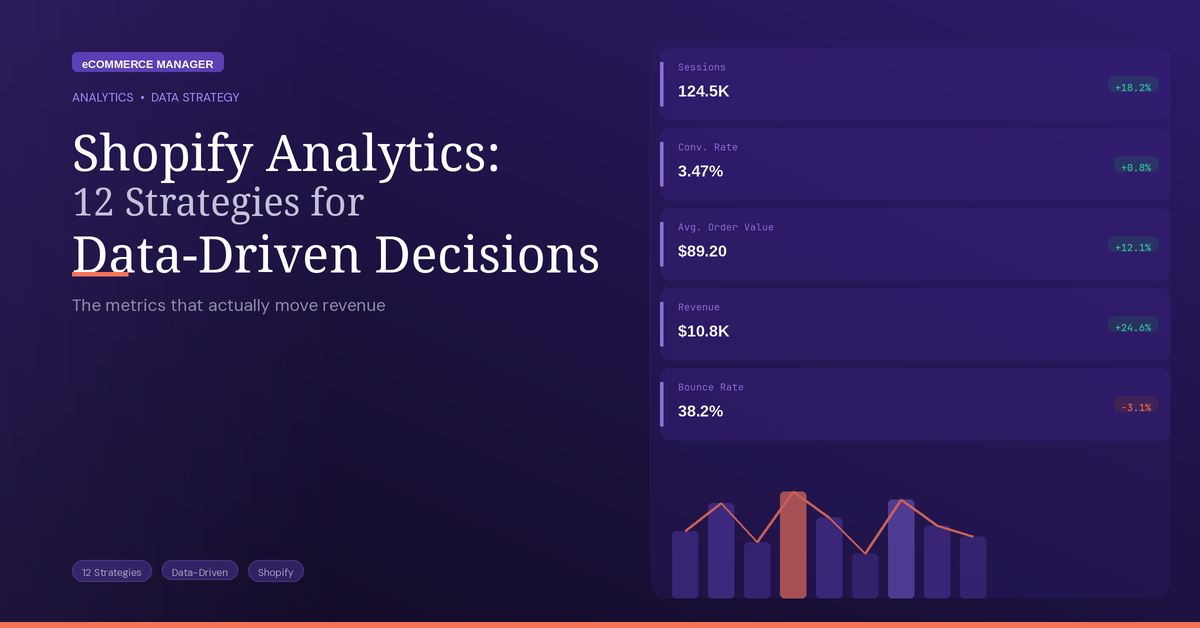
Shopify Analytics: 12 Strategies for Data-Driven Decisions
Running a profitable Shopify store requires more than intuition—it demands precise metrics and actionable strategies. This guide compiles twelve expert-backed approaches to transform raw data into revenue-boosting decisions, from delivery speed optimization to cohort retention analysis. Whether tracking acquisition costs or identifying conversion bottlenecks, these strategies help online retailers make smarter choices that directly impact the bottom line.
- Compare Channel Conversion Performance
- Boost Second-Order Rate by Acquisition Path
- Prioritize Month-Two and Three Retention
- Favor Lead-Product Cohorts with Reorders
- Use Inventory Turnover to Plan Stock
- Monitor Median Days to Delivery
- Assess Lifetime Value against CAC
- Spot Suburb-Level Demand Spikes Fast
- Track Initial-Touch Cost per Buyer
- Fix the Largest Funnel Leak Weekly
- Measure Revenue per Session by Source
- Shorten Time to the Next Sale
Compare Channel Conversion Performance
One high-impact strategy is to use Shopify analytics to identify and improve the largest drop-off point in your conversion funnel instead of trying to optimize everything at once.
The single metric I’d focus on is:
Conversion Rate by Traffic Source
Why this metric matters:
It connects marketing spend directly to revenue quality
It shows which channels bring buyers, not just visitors
It helps you avoid wasting money on “vanity traffic”
Small improvements here compound fast across ads, email, SEO, and social
In Shopify Analytics, you can compare channels like:
Instagram ads
Google Search
Email campaigns
Influencer traffic
Organic social
You’ll often discover patterns like:
TikTok brings lots of sessions but low purchases
Email has fewer visits but much higher conversion
Google Search converts best on high-intent products
That changes decision-making immediately:
Shift budget toward high-converting sources
Create more content for channels with strong buyer intent
Improve landing pages for weak but promising channels
For example:
If Instagram traffic converts at 0.5% and email converts at 4%, your next move may be growing your email list instead of increasing ad spend.
If Google traffic converts well but bounce rate is high on mobile, prioritize mobile page speed and checkout UX.
A practical workflow:
Open Shopify – Analytics – Reports – Sessions by referrer
Compare:
Sessions
Conversion rate
Average order value
Double down on the source with the best combination of:
High conversion
Sustainable acquisition cost
Strong repeat purchase behavior
The reason I prioritize this metric over raw revenue or traffic is that it helps answer the most important operational question:
“Which customer acquisition efforts are actually producing profitable customers?”

Boost Second-Order Rate by Acquisition Path
I run a direct-to-consumer longevity and supplement brand on Shopify, so I live in this dashboard daily, and the honest answer is that most founders watch the wrong number. The metric I focus on isn’t sessions, and it isn’t even conversion rate—it’s the 60-day repeat-purchase rate, segmented by the channel that acquired the customer.
Here’s why. For a consumable product the first order tells you almost nothing; it’s the reorder that tells you whether the product and the proposition actually landed. A channel can post a flattering conversion rate and a low cost per acquisition, then quietly send you customers who never come back—so you’ve bought revenue once and called it growth. When I started reading Shopify’s analytics as cohorts rather than daily totals, the picture inverted: the cheapest-to-acquire channel had the weakest 60-day reorder, and a “more expensive” one was actually our best because those customers stayed.
The practice that’s mattered: I pair reorder rate with contribution margin per cohort, not blended averages. Shopify’s reports plus a cohort view let me ask one question of every channel and campaign—does this bring back buyers at a margin we keep? Spend follows the answer. We shifted budget toward the cohorts that reordered and watched repeat revenue build while blended acquisition cost barely moved.
The principle from running it: vanity metrics measure the first transaction; durable brands are built on the second one. Pick the single number that proves a customer came back, pay to grow that, and the dashboard stops flattering you and starts steering you.
The Complete 2025 E-commerce Manager Career Guide: From Entry-Level to Executive

Prioritize Month-Two and Three Retention
The Shopify metric I anchor on is subscription churn, specifically month-2 and month-3 retention on our auto-ship cohorts. In a supplement business, the first order is a hypothesis. The second and third orders tell you whether the product actually did what the customer hoped—relief, regularity, whatever brought them in. Churn doesn’t lie.
When we saw a cohort dropping at month two, we didn’t touch acquisition spend. The team segmented by first-product SKU and cancel-survey reason, and the pattern pointed at expectation mismatch on probiotic timelines, not the formula. We rewrote the day-7 and day-21 education emails to set an honest timeline, adjusted the default cadence in Shopify subscriptions, and held a comparison cohort to confirm the lift wasn’t noise. Retention moved, and LTV followed. Paid acquisition only makes sense once that number is stable—so churn gets reviewed before we approve any growth decision.

Favor Lead-Product Cohorts with Reorders
The Shopify metric I care about most is repeat purchase rate by first product cohort. Revenue can look healthy for a month and still hide a weak business if the first order never turns into a second one.
We sell in categories where trust and reordering matter, so I want to know which first purchase creates the best downstream behavior. One product might convert well on the first click but attract low intent buyers who never come back. Another might have a lower front end conversion rate but produce stronger retention and better lifetime value. That’s the product I want to feature harder in paid traffic, email flows, and landing pages.
That metric also keeps the team honest. It forces us to think past top line sales and into customer quality, margin, and durability. In practice, we’ve used cohort behavior to change which products get more ad budget and which pages deserve more SEO support.
If you’re trying to make smarter decisions in Shopify, don’t just ask what sold today. Ask which first product creates the kind of customer you want more of six months from now.

Use Inventory Turnover to Plan Stock
One strategy I use with Shopify analytics is to monitor inventory turnover closely so purchasing aligns with actual sales. Tracking how quickly items sell through helps me avoid tying up cash in fabric and stock, a lesson I learned on Savile Row. I use that metric to time reorders and to assess whether to slow expansion or open new locations. Focusing on inventory turnover supports steady cash flow and keeps growth sustainable rather than chasing short-term profit.

Monitor Median Days to Delivery
Shopify has a wonderful pre-built report for shipping and delivery metrics that few seem to know about – navigate to your store Admin, Analytics, Reports, then select “Fulfillment, Shipping, and Delivery Metrics”.
This report allows store owners and managers to monitor trends around the delivery experience that might be impacting customers. If a partner shipping carrier is slipping, causing longer times in transit, or a 3PL is having trouble fulfilling orders in a timely fashion, it will show up here.
Using a simple line chart, it’s easy to spot outliers or problems before they grow – allowing store owners to proactively improve processes before customer loyalty is impacted.
One of my favorite metrics on that report is “median order days to delivery” – measuring the time from when the customer completes checkout until their package arrives. Perhaps more than any other delivery metric, it shows how changes made by a merchant in fulfillment processes, shipping carriers, or policies change the delivery experience.
The Complete 2025 E-commerce Manager Career Guide: From Entry-Level to Executive

Assess Lifetime Value against CAC
Shopify Analytics is a very powerful tool – and rightfully so. It has access to all your data and can give you amazing insights if you know what to look for. My favorite metric to look at in any store is customer lifetime value – which I then compare to acquisition cost. If you’re spending more to acquire a customer than they bring in over the next 12 months, then you know something is wrong with your strategy.

Spot Suburb-Level Demand Spikes Fast
I recommend building an automated dashboard in Shopify that surfaces search trends and inquiry patterns at the suburb level. I focus specifically on inquiry patterns by suburb because we used that metric to spot demand spikes in Belconnen and Gungahlin before competitors. Those insights allowed us to create hyperlocal landing pages and targeted ad campaigns quickly, which produced a new revenue stream for clients. Make sure the dashboard feeds directly into your content and campaign workflow so opportunities are acted on fast.

Track Initial-Touch Cost per Buyer
One strategy that holds: stop looking at sessions, start looking at conversion-rate-by-acquisition-source segmented by landing-page-version. Most Shopify merchants check the default analytics summary, see “sessions up, revenue flat,” and tweak ads. The real signal is buried in Acquisition > Channels cross-referenced with a Looker Studio overlay of landing-page URL.
The one metric I focus on: “first-touch cost per first-time-buyer” cohort-tracked over the 30 days after purchase. Not first-purchase ROAS (vanity, ignores returns and high-discount buyers), and not LTV in week one (too noisy). The 30-day cohort version answers “did this acquisition channel produce a real customer or a one-time discount hunter.”
For one US DTC apparel client (Shopify Plus, $1.4M ARR), this metric flagged that Meta Advantage+ on broad-interest audiences was producing first-purchase ROAS 3.1 (looked great) but 67% of those buyers returned 1+ items and never bought again. Same channel narrowed to lookalikes-of-repeat-buyers showed lower week-one ROAS (2.4) but 4.8x higher 90-day LTV. We cut $9,200/mo from broad audiences and moved it to the warm lookalike pod. Net contribution margin moved positive in 8 weeks.
Setup tip: pipe Shopify orders to Google Sheets via the native Shopify export plus a weekly Looker refresh. Free, takes one hour, beats every paid analytics tool I tested for SMB merchants.

Fix the Largest Funnel Leak Weekly
Caveat: my UK marketing agency works with ecommerce clients on Shopify rather than running my own Shopify store, but the analytics-to-decisions workflow is consistent across the client deployments. The strategy that produces the most data-driven decisions:
The strategy: build a single weekly “conversion drop-off” dashboard that tracks where in the funnel customers are exiting, and run weekly intervention experiments against the largest drop-off point.
The mechanic. Shopify’s default analytics dashboards show high-level metrics — sessions, conversion rate, AOV, revenue. These are useful for trend monitoring but they don’t tell you what to change. The transition from “monitoring data” to “data-driven decisions” requires a different question: “where in the funnel are customers exiting, and what’s the largest exit point I haven’t addressed yet?”
What the conversion drop-off dashboard tracks. Six stages with conversion rates between each. (1) Session to product page view. (2) Product page view to add-to-cart. (3) Add-to-cart to checkout start. (4) Checkout start to address entry. (5) Address entry to payment. (6) Payment to order placed. Each transition produces a drop-off rate. The largest drop-off versus industry benchmarks is the priority intervention point.
The intervention loop. Weekly cadence. (1) Monday: review the dashboard, identify the largest drop-off versus benchmark. (2) Tuesday: hypothesise what’s causing it — product page friction, shipping cost surprise, payment method limitation. (3) Wednesday-Thursday: design and ship an A/B test addressing the hypothesis. (4) Following Monday: review the test result, decide whether to ship the variant, then move to the next largest drop-off. The cadence produces 30-50 tested changes per year — far more than ad-hoc analytics review produces.
The specific impact at one client. An 8-month iteration cycle moved overall conversion rate from 1.4% to 2.7% across consecutive interventions. Each individual intervention contributed a small lift; the cumulative effect was material.
The wider principle. Shopify analytics produces decisions when you stop watching the top-line metrics and start watching the transitions between stages. The transitions reveal what to fix; the top-line tells you nothing actionable.
The single principle. Track the funnel, not the totals. Fix the biggest leak each week.

Measure Revenue per Session by Source
The Shopify analytics method provides the most actionable business insight by discarding the dashboard’s default metrics and focusing decision-making solely on one deeply revealing measure that most store owners never investigate.
The precise metric is “Revenue per Session by Traffic Source.”
Not a conversion rate. Not traffic volume. The average order value is not calculated separately. Revenue per session aggregates all three into a single statistic that reveals the true commercial quality of each traffic source at the same time, making budget allocation decisions clear rather than requiring complex multi-metric analysis.
This measure typically indicates an unexpected finding: the highest traffic sources rarely provide the highest revenue per session. Organic search traffic usually generates 3-4 times more revenue per session than social media traffic, but receiving much less visits.
Implementation in Shopify Analytics: a bespoke report combining Sessions and Total Sales, filtered by traffic source and calculated monthly.
One client reallocated $4,200 monthly social advertising budget toward SEO investment after revenue per session analysis revealed organic traffic generating $8.40 per session versus social’s $1.20.
Results within 90 days:
Overall revenue increased 34%
Marketing ROI improved $2.80 per dollar spent
Customer acquisition cost dropped $23 average
Shopify shows you what happened. Revenue per session shows you what mattered.
The Complete 2025 E-commerce Manager Career Guide: From Entry-Level to Executive

Shorten Time to the Next Sale
For Shopify, we like to look at the rate and speed of conversion from first to second order and understand the drivers that impact this, like which products lead to returning and quick returning customers, as well as which marketing campaigns and channels lead to the same.
The Complete 2025 E-commerce Manager Career Guide: From Entry-Level to Executive

Related Articles
- 21 Ecommerce Data Analytics: Key Metrics to Watch – eCommerce Manager
- 12 Social Media Tactics to Drive Sales on Your BigCommerce Store (With a Campaign Example)
- Driving Traffic To Your Shopify Store: 16 Effective Social Media Strategies