


Last Updated on August 26, 2026
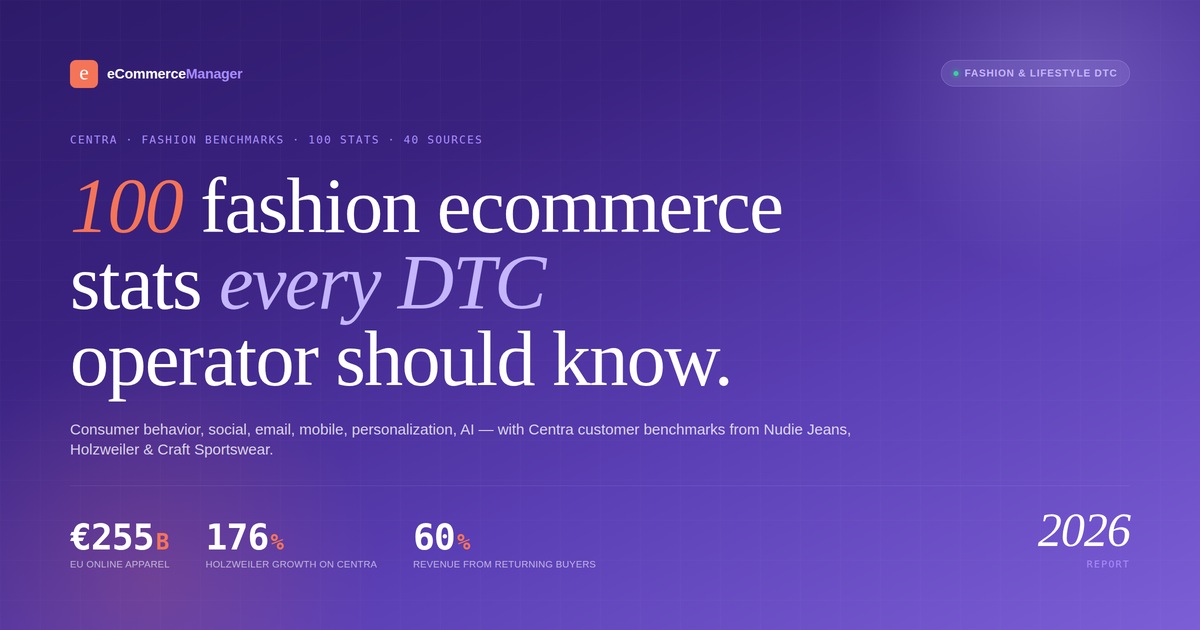
100 Centra & Fashion Ecommerce Statistics for 2026: Consumer Behavior, Social, Email, Mobile, Personalization & AI
The 100 numbers fashion & lifestyle DTC operators need for 2026 — sourced from eMarketer, McKinsey, Klaviyo, Adobe, Centra customer data, and 35+ other primary sources.
- Overview
- How fashion & lifestyle shoppers buy in 2026
- Where fashion actually gets discovered
- The retention channel apparel brands can't skip
- The mobile handoff is done for fashion
- The revenue lift most fashion brands leave on the table
- Where AI actually moves numbers for fashion brands
- Key Takeaways
- Frequently asked questions
- References
On this page
- Overview
- How fashion & lifestyle shoppers buy in 2026
- Where fashion actually gets discovered
- The retention channel apparel brands can't skip
- The mobile handoff is done for fashion
- The revenue lift most fashion brands leave on the table
- Where AI actually moves numbers for fashion brands
- Key Takeaways
- Frequently asked questions
- References
The state of B2C fashion & lifestyle ecommerce, in 100 numbers
Fashion carries the lowest conversion rates and the highest return rates in ecommerce. 60% of DTC fashion revenue comes from returning customers. Cross-border is 38% of European apparel transactions. Mobile is 79% of fashion site traffic. Those four sentences frame every operational decision an apparel brand makes in 2026.
This report pulls 100 sourced stats across consumer behavior, social, email, mobile, personalization, and AI — with fashion-specific benchmarks where they exist and B2C-wide data where the pattern still applies. Centra customer data from Nudie Jeans, Holzweiler, Craft Sportswear, and Soft Goat is included where it illustrates what composable commerce looks like when it works at scale. Skim the sections that matter, and use the platform calculator or directory to act on what stands out.
How fashion & lifestyle shoppers buy in 2026
Fashion carries the lowest conversion rates in ecommerce and the highest return rates. 25% of apparel orders come back. 60% of DTC fashion revenue comes from returning customers. That's the shape of the P&L before you touch anything else.
-
01Global retail ecommerce hits $6.88 trillion in 2026, and apparel accounts for 19.6% of all US online retail spend. [4,7]
-
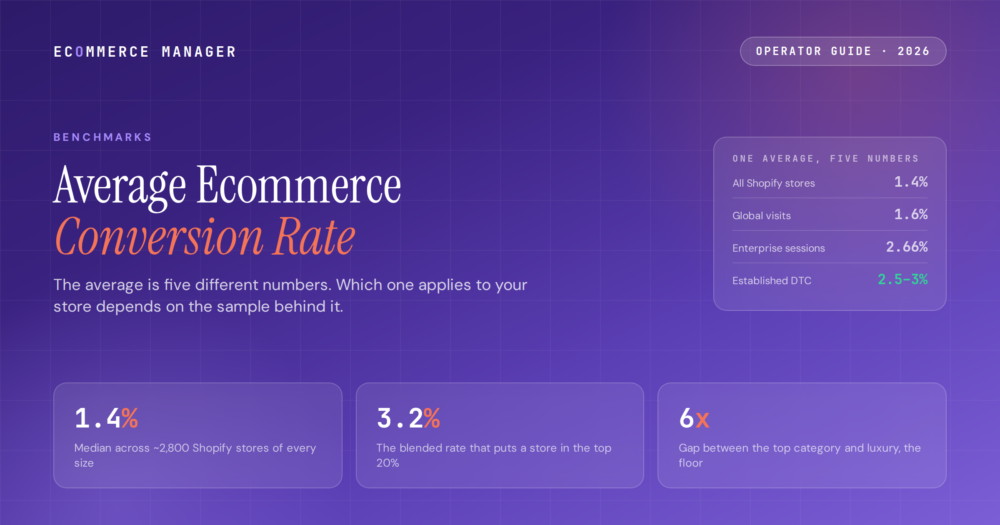
02The average fashion ecommerce conversion rate sits at 2.0% to 3.15%, versus 5.37% for beauty and 5.03% for food & beverage. [33,34]
-
03Fashion return rates average 24% to 26% at DTC brands, nearly double the ecommerce-wide 14.2%. Processing a single return costs 20% to 65% of the item's price. [31,23]
-
0460% of DTC fashion revenue comes from returning customers, who convert at 60% to 70% versus 5% to 20% for new prospects. [23]
-
05Only 12% to 17% of apparel DTC customers return for a second purchase within 365 days, and 77% of those who do come back within 30 days of their first order. [32]
-
06US apparel ecommerce is forecast at $241.4 billion in 2026, or 64.7% of total US apparel spend. [7]
-
07Europe's online apparel market reached €255.77 billion in 2026, growing at 8.23% CAGR through 2034. [10]
-
08Everlane converts at 3.5%, 59% above the apparel category average of 2.2% — driven almost entirely by returning-customer traffic share. [23]
-
09Cross-border fashion purchases in Europe reached 38% of all apparel transactions in Q1 2026, and average cross-border spend is up 31% since 2023. [11]
-
10The average shopping cart abandonment rate is 70.22% across all devices, with fashion typically running 3 to 5 points above the average. [19]
-
11Apparel & accessories will command 36.3% of global cross-border ecommerce in 2026, the largest single category share. [8]
-
12Consumers spend $66.58 per apparel item online on average, and $12.83 more per order than for non-apparel categories. [7]
-
13DTC fashion CAC ranges from $37 to $120, with most established brands landing at $45 to $75. Return-adjusted CAC sits 26% to 35% higher. [23]
-
14Apparel DTC gross margins run 60% to 70%, with 20% to 30% operating margin and 10% to 20% net — the corridor most brands optimize inside. [23]
-
15Nudie Jeans on Centra has averaged 24% yearly growth across 54 active markets, run by a small in-house team. [1]
-
16Holzweiler's ecommerce sales grew 176% net after switching to Centra in 2020, with just five people serving 20 global markets. [1]
-
17Craft Sportswear's Centra migration delivered a 100% boost in website traffic and ecommerce revenue, per Centra's published case data. [1]
Weighing headless for your fashion brand?
Compare Centra against Shopify Plus, BigCommerce, and Adobe Commerce on multi-market, wholesale, and TCO in the ECM platform calculator.
The retention channel apparel brands can't skip
Fashion returns eat margin, and paid CAC is up 25% to 40% year over year. Email is the only owned channel where the unit economics actually get better as your brand grows. A well-run apparel email program should carry 25% to 35% of store revenue.
-
01Ecommerce email delivers $45 for every $1 spent in retail and consumer goods, rising to $72 for US ecommerce brands with mature programs. [12,14]
-
02Email should generate 20% to 30% of total DTC revenue, per Digiday's benchmark data. Anything less signals underinvested automation. [31]
-
03Automated emails are 2% of sends and 30% of revenue, earning 16x more per send than scheduled campaigns. [12]
-
04Welcome emails hit 83.6% open rates, the highest of any automated email type in ecommerce. [15]
-
05Abandoned cart emails deliver the highest CTR of any automation at 23.33% and convert at 3.33% on average (7.69% for top performers). [12]
-
06Segmented campaigns generate 760% more revenue than non-segmented sends, per Klaviyo's 2026 benchmark. [13]
-
07Personalized email subject lines lift open rates by 26%, and AI-generated subject lines outperform human ones by roughly the same margin. [12]
-
0859% of marketers name email their #1 revenue channel, ahead of social (14%) and paid search (12%). [16]
-
09Ecommerce brands using email marketing generate 17% more revenue than those that don't, per Klaviyo. [13]
-
10Global campaign open rates averaged 30.7% in 2025, the fifth consecutive year of increase. [12]
-
1144.14% of email clicks happen within 60 minutes of send. Send-time optimization matters more than most brands realize. [15]
-
1264% of email opens now happen on mobile, and non-mobile-optimized emails get deleted within seconds. [16]
-
13Email converts at 4.0% to 5.3%, the highest of any traffic source — more than 4x the paid social conversion rate (0.7% to 1.2%). [34]
-
14SMS marketing delivers an 11% CTR and 2.4% conversion rate, and at least 4 in 10 DTC brands now run SMS alongside email. [31]
-
15Automated welcome emails in ecommerce have an average conversion rate of nearly 3%, the highest of any triggered flow. [15]
-
16Nearly 50% of consumers report making a direct purchase from an email in the past year, per Litmus. [14]
-
17The global email marketing market grows from $11.5 billion in 2025 to $17.9 billion by 2028 — a 15.8% CAGR. [12]
The mobile handoff is done for fashion
79% of fashion ecommerce traffic is mobile. Apparel shoppers are 3.72% more likely to use a phone than the general ecommerce buyer. The mobile web vs. native app gap is the biggest unused optimization lever most fashion brands have.
-
0179% of fashion ecommerce site traffic comes from mobile devices, and apparel shoppers are 3.72% more likely to be on a phone than the average online buyer. [7]
-
02Global mobile commerce hits $2.4 trillion in 2026, growing at 9.5% CAGR through 2034. [18]
-
03Mobile drives 60% of all ecommerce sales worldwide and 78% of all retail website traffic. [17]
-
04The average mobile ecommerce conversion rate reached 2.8% in 2026, finally matching desktop after years at 1.8%. [18]
-
05Shopping apps convert at 3.5%, roughly 75% higher than mobile web at 2%. Time in app is 18x higher than mobile web. [18]
-
06Mobile cart abandonment sits at 80% to 84%, compared to 66.4% on desktop. [19]
-
0788% of consumers use mobile shopping apps, and 52% use them at least weekly. [18]
-
08Average mobile order value is $112.29 versus $155 on desktop — a $43 gap that represents billions in unrealized apparel revenue. [18]
-
09AR try-on drives up to 94% higher conversion on apparel — sizing anxiety is fashion's largest source of cart abandonment. [32]
-
10Reducing mobile page load time by 1 second lifts conversion by 5.6%, per Google's Core Web Vitals data. [17]
-
1158.2% of US mobile clothing shoppers are women, and Instagram/Pinterest drive the highest apparel discovery traffic on mobile. [7]
-
12Global mobile wallets are projected to process $16 trillion+ in transactions in 2026, with 5+ billion active users. [18]
-
13Mobile apps account for 54% of mobile commerce transactions, and apparel dropshipping/retention brands are moving fastest to native. [18]
-
14The Asia-Pacific region generates 55%+ of global mobile commerce revenue, with fashion a top-3 category. [17]
-
15Global mobile commerce revenue is forecast at $3.35 trillion by 2028. [17]
-
16Fashion e-commerce apps like Nike (9.77M downloads) and Poshmark (7.14M) demonstrate the pull of native app experiences for apparel discovery. [7]
-
1770% of purchases in 2024 occurred via mobile apps, not mobile web, reflecting shopper preference for one-tap checkout. [18]
Fashion returns are 25% and eating your margin.
Browse vetted CRO, retention, and AI sizing partners in the ECM directory — the fastest way to fix return-adjusted CAC.
The revenue lift most fashion brands leave on the table
McKinsey pegs personalization revenue lift at 5% to 15% for well-run programs. Fashion sits at the upper end of that range because sizing, style, and taste are almost pure signal data. The gap between average and excellent is measured in eight-figure revenue swings for mid-market apparel.
-
01Well-implemented personalization drives revenue increases of 10% to 30%, with fashion at the upper end of the range. [20]
-
0271% of consumers expect personalized interactions, and 76% get frustrated when brands don't deliver. [20]
-
03Personalized product recommendations account for 26% to 31% of ecommerce revenue for stores that implement them. [25,26]
-
04Amazon attributes 35% of total revenue to its recommendation engine — the benchmark most personalization vendors cite. [26]
-
05Shoppers who click a recommendation are 4.5x more likely to add to cart and spend 5x more than average shoppers. [26]
-
0680% of consumers are more likely to purchase from brands offering personalized experiences, per Epsilon. [27]
-
0745% of ecommerce stores use some form of personalization in 2026, up from 28% in 2023. [29]
-
08Personalization delivers 5x to 8x ROI, with stores seeing 15% to 30% higher conversion and 10% to 20% higher AOV. [20]
-
09Fast-growing companies generate 40% more revenue from personalization than slower-growing competitors. [20]
-
10Personalized CTAs convert 202% better than generic ones across cross-industry testing. [29]
-
1189% of marketers report positive ROI from personalization, and 87% plan to increase spending in 2026. [29]
-
12Personalized email hero images lift CTR by 41%, and personalized creative on paid social lifts CTR by 22% to 40%. [30]
-
13Brands with advanced personalization grow 2x faster than brands with limited or no personalization, per BCG. [28]
-
14Real-time personalization delivers 20% higher conversion than batch processing, and 40% revenue lift at the excellence tier. [29]
-
15Personalized email flows can generate up to 18x the revenue per recipient of generic campaigns, per McKinsey. [20]
-
1668% of Gen Z shoppers are more likely to buy when product visuals reflect someone like them — the case for size- and demographic-inclusive imagery. [30]
Where AI actually moves numbers for fashion brands
89% of retailers have adopted AI. 7% have scaled it. That 82-point gap is the whole story of AI in fashion commerce right now — everyone is running pilots, almost no one is running production. Fashion brands that close the gap first will compound the advantage on returns, sizing, and personalization.
-
01Generative AI and AI agents drove $262 billion in global retail revenue during the 2025 holiday season, roughly 20% of total sales. [5]
-
02Traffic from AI sources to US retail sites grew 393% YoY in Q1 2026 and 4,700% during the 2025 holiday window. [6]
-
03AI-referred traffic converts 31% to 42% higher than non-AI traffic, and those shoppers spend 45% more time on-site. [6]
-
0489% of retailers have adopted AI, but only 7% have fully scaled it, per McKinsey's 2026 maturity data. [20]
-
0559% of Americans use generative AI for shopping tasks, and 56% used it during the 2025 holiday season — up from 11% in 2024. [24]
-
0661% of Gen Z used AI to help with a purchase in the past year, the highest adoption rate of any demographic. [24]
-
07The global generative AI in ecommerce market hit $1.11 billion in 2026, forecast at $3.95 billion by 2035. [24]
-
0846% of DTC brands used AI-generated product visuals in 2026, cutting shoot costs and enabling market-specific creative for cross-border storefronts. [30]
-
0969% of retailers with AI implementations report measurable revenue increases directly attributable to their AI investments. [24]
-
10AI chatbots cut cart abandonment by 20% to 30% and drive 36% more repeat purchases through post-sale engagement. [24]
-
11AI implementation improves ecommerce customer retention by 10% to 15% — a direct fix for fashion's chronic repeat-purchase problem. [31]
-
12Only 14% of consumers trust AI for autonomous purchasing, even as 73% use AI somewhere in their shopping journey. [36]
-
13Roughly 33% of online retailers will use advanced AI agents by 2028, up from under 1% today — potentially influencing $385 billion in US ecommerce by 2030. [37]
-
14AI-driven virtual try-on and size prediction is the top fashion-specific AI use case, with brands reporting 20% to 40% reductions in size-related returns. [30]
-
1575% of consumers prefer AI chatbots over human agents for straightforward questions, provided the AI stays accurate and on-brand. [24]
-
16Composable, API-first platforms like Centra make AI integration materially faster, since best-of-breed personalization, PIM, and recommendation tools plug directly into the commerce layer without core rebuilds. [2,3]
Six patterns fashion & lifestyle operators should internalize
Fashion economics are about retention, not acquisition. Only 12% to 17% of apparel DTC customers come back within a year. 60% of revenue comes from the ones who do. If your email and lifecycle programs aren't the biggest line item in your revenue mix, that's the whole opportunity.
Sizing is the biggest single lever left for apparel. AR try-on lifts conversion up to 94%. AI size prediction cuts returns 20% to 40%. Both are mature enough to deploy in 2026 — the barrier is integration, not the tech.
Cross-border is fashion's growth story. 36.3% of global cross-border ecommerce is apparel. 38% of European apparel transactions cross a border. Platforms built for multi-market operation (unlimited currencies, markets, price lists, warehouses) have a structural advantage here.
Social commerce is TikTok Shop's story, and apparel is one of TikTok's fastest-growing verticals. $15.82 billion in US sales in 2025, 108% growth, 2.6x Facebook's conversion rate. The brands testing now will own the channel by 2027.
AI adoption looks universal (89%) but is still mostly pilots (7% scaled). The 82-point gap closes over the next 24 months. First movers on scaled, revenue-attached AI — not experiments — will compound.
Composable/headless architecture is now the default for scaling fashion DTC. The Centra customer benchmarks — Nudie Jeans at 24% yearly growth across 54 markets, Holzweiler at 176% net growth with five people — show what the model looks like when it works. Cross-reference against Shopify Plus, BigCommerce, and Adobe Commerce in the ECM platforms hub before you commit.
Frequently asked questions
What is Centra and who is it for?
Centra is an API-first, composable commerce platform built specifically for global fashion and lifestyle brands. Founded in Stockholm in 2015, it supports both DTC and wholesale in a single platform, with unlimited markets, currencies, price lists, and warehouses out of the box. Its customer base skews toward premium apparel and lifestyle brands like Nudie Jeans, Filippa K, Craft Sportswear, Holzweiler, ETON, Sandqvist, and Norse Projects. 83% of reviewers on Capterra are from small businesses; 48% are in apparel and fashion.
What conversion rate should a fashion ecommerce brand target in 2026?
The apparel category average is 2.0% to 3.15%, versus 5.37% for beauty and 5.03% for food & beverage. Top-quartile fashion brands sit at 3.5%+, with returning-customer traffic share the biggest driver. Everlane's 3.5% conversion rate is 59% above the apparel average, and it's driven almost entirely by repeat visitors. Focus on retention math, not just prospecting.
How much does fashion ecommerce lose to returns?
The apparel category average return rate is 24% to 26%, nearly double the ecommerce-wide 14.2%. Processing a single return costs 20% to 65% of the item's original price. Direct costs include $8 to $12 for return shipping, $5 to $8 for inspection, and $2 to $4 for restocking. This is why AI sizing tools, AR try-on, and better product imagery deliver such fast payback for apparel brands.
What's the ROI of email marketing for a DTC apparel brand?
Global ecommerce email ROI averages $45 per $1 spent for retail and consumer goods, rising to $72 per $1 for US ecommerce brands with mature programs. A well-run email program should generate 20% to 35% of total store revenue for a DTC apparel brand. Automated flows (welcome, abandoned cart, post-purchase, winback) account for 2% of sends but 30%+ of revenue — that's where the leverage is.
Why do fashion brands choose composable/headless platforms like Centra?
Fashion brands need speed to market across many geographies, custom brand experiences that don't fit theme templates, and best-of-breed integrations for PIM, personalization, and OMS. Centra's Nudie Jeans case study shows the model: 24% average yearly growth, 54 active global markets, small in-house team. Holzweiler grew 176% net after switching, with just five people serving 20 markets. The advantage is operational leverage, not just design flexibility.
The playbook top eComm operators actually read
One weekly brief. Five stories that matter. Zero fluff. Written for managers at $5M–$50M DTC brands who want to sound sharper than everyone else in the meeting.
References
- 01 Centra — Customer Success Stories (Nudie Jeans, Holzweiler, Craft Sportswear) — centra.com
- 02 Vervaunt — Centra Ecommerce Platform Review — vervaunt.com
- 03 Capterra — Centra Software Profile 2026 — capterra.com
- 04 eMarketer 2026 Worldwide Retail Ecommerce Forecast — emarketer.com
- 05 Adobe Analytics — 2025 Holiday Shopping Report — adobe.com
- 06 Adobe Digital Insights — AI Referral Traffic Q1 2026 — adobe.com
- 07 Capital One Shopping — Online Clothing Statistics 2026 — capitaloneshopping.com
- 08 Coherent Market Insights — Cross-Border Ecommerce Report 2026 — coherentmarketinsights.com
- 09 Verified Market Research — Europe Ecommerce Apparel Market — verifiedmarketresearch.com
- 10 Market Data Forecast — Europe Online Apparel Market — marketdataforecast.com
- 11 European E-Commerce Association — Q1 2026 Benchmark Report — ecommerce-europe.eu
- 12 Omnisend — 2026 Ecommerce Marketing Statistics Report — omnisend.com
- 13 Klaviyo 2026 Ecommerce Benchmark Report — klaviyo.com
- 14 Litmus State of Email 2026 — litmus.com
- 15 GetResponse Email Marketing Benchmarks — getresponse.com
- 16 HubSpot State of Marketing 2026 — hubspot.com
- 17 Statista — Global Retail Mobile Commerce Sales — statista.com
- 18 Fortune Business Insights — Mobile Commerce Market — fortunebusinessinsights.com
- 19 Baymard Institute — Cart Abandonment Research — baymard.com
- 20 McKinsey — Next in Personalization 2023 — mckinsey.com
- 21 eMarketer US Social Commerce Forecast 2026 — emarketer.com
- 22 Mordor Intelligence — Social Commerce Market — mordorintelligence.com
- 23 Foundry CRO — DTC Fashion Marketing Benchmarks 2026 — foundrycro.com
- 24 Precedence Research — Generative AI in E-commerce Market — precedenceresearch.com
- 25 Salesforce Shopping Index Q4 2025 — salesforce.com
- 26 Barilliance — Product Recommendation Statistics — barilliance.com
- 27 Epsilon — Power of Me Personalization Study — epsilon.com
- 28 BCG — Profiting from Personalization — bcg.com
- 29 Twilio Segment State of Personalization 2026 — segment.com
- 30 Vogue Business — DTC Visual AI Report 2026 — voguebusiness.com
- 31 Ringly.io — DTC Ecommerce Statistics 2026 — ringly.io
- 32 1800DTC — 2026 Fashion DTC Playbook — 1800dtc.com
- 33 Cartflows — Ecommerce Conversion Rate Benchmarks 2026 — cartflows.com
- 34 Convertibles — Ecommerce Conversion Rate by Industry 2026 — convertibles.dev
- 35 Insider Intelligence — Livestream Shopping Forecast — insiderintelligence.com
- 36 Riskified — AI Trust in Commerce 2026 — riskified.com
- 37 Morgan Stanley — Agentic Commerce 2030 Outlook — morganstanley.com
- 38 Amra & Elma — Social Commerce Statistics 2026 — amraandelma.com
- 39 Market Data Forecast — Europe Cross-Border Ecommerce — marketdataforecast.com
- 40 Capital One Shopping — Cross-Border Ecommerce Statistics 2026 — capitaloneshopping.com
Make every fashion DTC decision data-backed
Join 12,000+ ecommerce managers reading the ECM newsletter every Tuesday — or browse the directory to find vetted CRO, retention, AI, and headless commerce partners.

Where fashion actually gets discovered
Fashion is the discovery category on social. TikTok Shop's fastest-growing verticals are apparel and accessories; Instagram is where Gen Z browses before it buys. The channel isn't optional for a lifestyle brand in 2026 — it's how the top of funnel exists.