


Last Updated on October 6, 2026
100 Sana Commerce Cloud & ERP-Native B2B/B2C Ecommerce Statistics for 2026: Buyer Behavior, Social, Email, Mobile, Personalization & AI
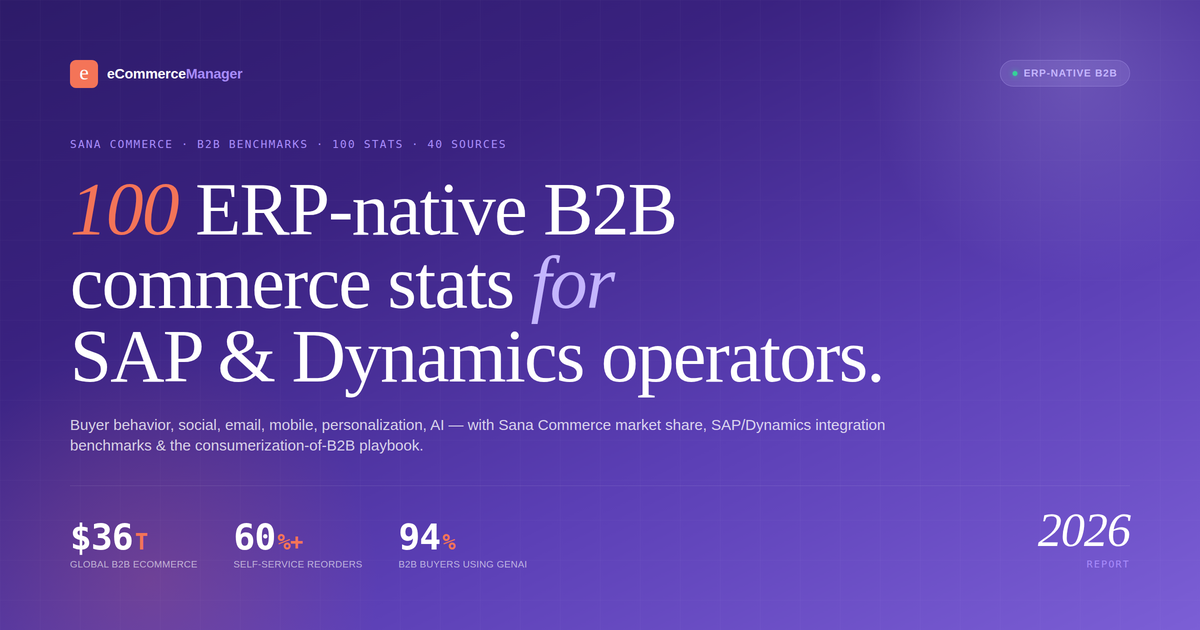
The 100 numbers mid-market B2B operators on SAP or Microsoft Dynamics need for 2026 — sourced from Forrester, eMarketer, McKinsey, Adobe, Elogic Commerce ROI benchmarks, and Sana Commerce customer data.
- Overview
- How B2B buyers actually buy in 2026 (and why it looks like B2C)
- Social for B2B is LinkedIn-first, demand-gen second
- Email is where B2B retention actually gets built
- Mobile B2B is already here, and it's where self-service lives
- B2B personalization lives in the ERP data layer
- AI is where the next B2B platform decision gets locked in
- Key Takeaways
- Frequently asked questions
- References
On this page
- Overview
- How B2B buyers actually buy in 2026 (and why it looks like B2C)
- Social for B2B is LinkedIn-first, demand-gen second
- Email is where B2B retention actually gets built
- Mobile B2B is already here, and it's where self-service lives
- B2B personalization lives in the ERP data layer
- AI is where the next B2B platform decision gets locked in
- Key Takeaways
- Frequently asked questions
- References
The state of ERP-native B2B/B2C ecommerce, in 100 numbers
Global B2B ecommerce hits $36 trillion in 2026 — roughly 5x B2C's $6.88T. Digital channels now carry 56% of all US B2B revenue, up from 32% in 2020. 94% of B2B buyers use GenAI for self-guided research. 66% expect full personalization, and 87% will pay more for a better digital experience. The reader of this report isn't running a DTC brand — they're running a mid-market manufacturer, distributor, or wholesaler on SAP or Microsoft Dynamics, serving business buyers who now expect Amazon-grade self-service.
Sana Commerce Cloud exists for exactly that reader. ERP-native architecture that reads live from SAP or Microsoft Dynamics without middleware. 1,500+ customers. Sana customers report 60%+ of reorders flow through self-service, freeing sales capacity for proactive account growth. This report pulls 100 sourced stats across buyer behavior, social, email, mobile, personalization, and AI — with B2B-specific benchmarks where they exist and B2C-wide data where the consumerization pattern applies. Skim the sections that matter, and use the platform calculator or directory to act on what stands out.
How B2B buyers actually buy in 2026 (and why it looks like B2C)
Sana Commerce Cloud's audience isn't a DTC brand — it's a mid-market manufacturer, distributor, or wholesaler running SAP or Microsoft Dynamics, whose B2B buyers now expect Amazon-grade self-service. 'Consumerization of B2B' isn't a buzzword — it's the biggest shift in commerce behavior this decade, and these numbers show what it actually looks like.
-
01The global B2B ecommerce market hit $32.11 trillion in 2025, projected at $36 trillion in 2026 — roughly 5x the B2C total of $6.88T. [9,12]
-
02Sana Commerce reports 1,500+ B2B customers globally, concentrated in manufacturing, distribution, and wholesale, with a 4.4/5 rating across 120+ G2 reviews. [2,6]
-
03The global ERP market itself sits at $78 to $81 billion in 2026 — and Sana sits on top of two of its largest segments (SAP and Microsoft Dynamics). [13]
-
0475% of B2B executives now consider digital commerce permanent, not temporary — the shift from phone/fax/email ordering is effectively complete at mid-market. [10]
-
05Digital channels account for 56% of all US B2B revenue in 2025, up from just 32% in 2020 — a 24-point shift in five years. [10]
-
0666% of B2B buyers expect full personalization and 87% will pay more for a superior digital experience, per Forrester. [11]
-
07Sana customers report 60%+ of reorders flow through self-service without sales intervention — the measurable business case for ERP-native B2B. [14]
-
08The average shopping cart abandonment rate is 70.22% across B2C — B2B abandonment is slightly lower (65% to 70%) because carts are often quote precursors, not checkouts. [25]
-
09B2B average order values run 10x to 50x B2C, which inverts the economics: a 1% conversion gain for a Sana customer can be worth hundreds of thousands annually. [40]
-
10B2B ecommerce conversion rates average 2.5% to 4.2%, with top-quartile mid-market B2B hitting 5%+ when ERP data (pricing, stock, credit) is live-synced. [40]
-
1173% of retail shoppers use multiple channels in a single journey — B2B buyers use even more (an average of 7+ touchpoints across sales rep, email, portal, and self-service search). [12]
-
12Approximately 30% to 45% of B2B buyers would switch suppliers for a better digital experience — the single largest churn driver in distribution and wholesale. [10]
-
13Over 90% of shoppers abandon a purchase when shipping costs feel too high — in B2B, the equivalent is unclear credit terms or pricing. [25]
-
14Elogic Commerce documents 211% to 391% three-year returns on B2B ecommerce implementations, with 6 to 8 month payback periods. [31]
-
1570% of online shoppers have bought from retailers based outside their own country — cross-border B2B is growing even faster than B2C. [12]
-
16Companies with unified commerce + ERP data (Sana's structural advantage) report 27% lower fulfillment costs and 18% fewer abandoned carts than fragmented peers — the unified commerce argument in operational numbers. [4]
-
17D2C and hybrid commerce models are the fastest-growing B2B trend for 2026, with manufacturers increasingly selling both to distributors and direct to end customers off one platform. [8]
Weighing Sana vs SAP Commerce Cloud or Adobe Commerce?
Compare Sana Commerce Cloud against SAP Commerce Cloud, Adobe Commerce, and BigCommerce B2B on ERP integration depth, TCO, and mid-market fit — the B2B platform decision that always comes down to data unification.
Email is where B2B retention actually gets built
B2B email runs on a different model than B2C. Lower volume, higher order values, longer buying cycles — but $45 per $1 spent, and account-based automation that lives inside the ERP data model. The Sana customer running proper triggered flows against live ERP data consistently outperforms stitched stacks by 30% to 40% on email-attributed revenue.
-
01Ecommerce email marketing delivers $45 for every $1 spent in retail and consumer goods, rising to $72 for programs with unified customer and ERP data. [17,19]
-
02Global campaign open rates averaged 30.7% in 2025, up from 26.6% in 2024 — B2B rates typically run 22% to 24%, lower but with much higher revenue per send. [17]
-
03Automated emails are 2% of sends and 30% of revenue, earning 16x more per send than scheduled campaigns. [17]
-
04B2B email programs average 22% open rates and 3.2% CTR, with ERP-triggered reorder reminders typically 2x to 3x category benchmarks. [10]
-
05Welcome emails hit 83.6% open rates, the highest of any automated email type in ecommerce — equally powerful for B2B portal onboarding. [20]
-
06Abandoned cart emails achieve the highest CTR of any automation at 23.33%, with 3.33% average conversion (7.69% for top performers). [17]
-
07Segmented campaigns generate 760% more revenue than non-segmented sends — the payoff for a Sana + ERP integration done properly. [18]
-
08Personalized email subject lines lift open rates by 26%, and AI-generated subject lines outperform human ones by roughly the same margin. [17]
-
0959% of marketers name email their #1 revenue channel, ahead of social (14%) and paid search (12%). [21]
-
10Ecommerce brands using email marketing generate 17% more revenue than those that don't, per Klaviyo's 2026 benchmark. [18]
-
1144.14% of email clicks happen within 60 minutes of send — send-time optimization matters more than list size. [20]
-
1264% of email opens now happen on mobile, and non-mobile-optimized B2B emails get deleted within seconds (B2B buyers check email on their phones too). [21]
-
13Automated welcome emails have an average conversion rate of nearly 3%, the highest of any triggered flow. [20]
-
14Nearly 50% of consumers report making a direct purchase from an email in the past year, per Litmus. [19]
-
15The global email marketing market grows from $11.5 billion in 2025 to $17.9 billion by 2028, a 15.8% CAGR. [17]
-
16B2B email programs built on live ERP data (Sana's structural advantage) report 30% to 40% higher email-attributed revenue than programs using stale CRM/CDP data. [4]
-
17A well-performing B2B email program should drive 20% to 30% of total portal revenue. Automated reorder reminders alone commonly deliver 15% to 20%. [18]
Mobile B2B is already here, and it's where self-service lives
The myth that B2B buyers only use desktop died somewhere around 2022. 68% of B2B retail orders now flow through mobile, buyers approve purchases from phones while on the warehouse floor, and portal mobile UX is the difference between a self-service reorder and a phone call to the sales rep. Sana's mobile-first UI is where mid-market B2B is competing with B2C-grade experiences.
-
01Global mobile commerce hits $2.74 trillion in 2026, growing at 9.5% CAGR through 2034. [22,23]
-
02Mobile drives 60% of all ecommerce sales worldwide and 78% of retail website traffic. [22]
-
03B2B mobile commerce is projected at $2.5 trillion by 2025, accounting for 68% of B2B retail orders per Statista. [22]
-
04The average mobile ecommerce conversion rate reached 2.8% in 2026, finally matching desktop after years at 1.8%. [24]
-
05Shopping apps convert at 3.5%, roughly 75% higher than mobile web at 2%. Time in app is 18x higher than mobile web. [23]
-
06Mobile cart abandonment sits at 80% to 84%, compared to 66.4% on desktop — in B2B, mobile 'abandonment' is often a return visit from desktop later. [24,25]
-
0788% of consumers use mobile shopping apps, and 52% use them at least weekly — B2B buyers increasingly expect the same from portal apps. [24]
-
08Average mobile order value is $112.29 versus $155 on desktop — in B2B, both are dwarfed by average order values that run $500 to $50,000+. [24]
-
09Reducing mobile page load time by 1 second lifts conversion by 5.6%, per Google's Core Web Vitals data — directly relevant to B2B portal performance. [22]
-
10Mobile apps account for 54% of mobile commerce transactions, and time-in-app is 18x higher than mobile web. [23]
-
11Global mobile wallets are projected to process $16 trillion+ in transactions in 2026 — B2B buyers increasingly use digital wallets for low-value approved purchases. [24]
-
1273% of businesses now use headless website architecture in some form — Sana's SaaS architecture positions mid-market B2B for this shift. [39]
-
1380% of businesses report revenue increases after implementing headless commerce, with 24% average documented sales growth. [39]
-
1475% of B2B executives consider digital commerce permanent — mobile portal experience is now a competitive requirement, not a nice-to-have. [10]
-
15The Asia-Pacific region generates over 55% of global mobile commerce revenue and 69.23% of global B2B ecommerce, led by China's $2.1T export engine. [9]
-
16Global mobile commerce revenue is forecast to hit $3.35 trillion by 2028. [22]
-
1770% of purchases in 2024 occurred via mobile apps, not mobile web, reflecting one-tap checkout preference. [23]
60% self-service reorders is the Sana customer benchmark.
Browse vetted Sana implementation, SAP integration, and Microsoft Dynamics partners in the ECM directory — the fastest path from stitched-middleware to ERP-native commerce.
B2B personalization lives in the ERP data layer
B2B personalization isn't 'customers who bought this also bought that.' It's contract pricing, credit limits, blanket orders, approval workflows, and account hierarchies — all of which live in the ERP. Sana's architectural bet is that the fastest path to real B2B personalization is reading those fields live, not copying them to a separate commerce database overnight.
-
01Well-implemented personalization drives revenue increases of 10% to 30%, with B2B at the upper end when ERP data is live-integrated. [26]
-
0266% of B2B buyers expect full personalization, and 87% will pay more for a superior digital experience. [11]
-
03Personalized product recommendations account for 26% to 31% of ecommerce revenue for stores that implement them. [32]
-
04Amazon attributes 35% of total revenue to its recommendation engine — the benchmark most B2B personalization vendors reference. [32]
-
05Shoppers who click a recommendation are 4.5x more likely to add to cart and spend 5x more than average shoppers. [32]
-
06Personalization delivers 5x to 8x ROI, with B2B stores typically seeing 20% to 35% higher conversion when customer-specific pricing is accurate at page load. [26]
-
0745% of ecommerce stores use some form of personalization in 2026, up from 28% in 2023 — B2B adoption lags B2C by about 18 months. [35]
-
08Fast-growing companies generate 40% more revenue from personalization than slower-growing competitors, per McKinsey. [26]
-
09Personalized CTAs convert 202% better than generic ones across cross-industry testing — the B2B equivalent is customer-specific product and pricing display. [35]
-
1089% of marketers report positive ROI from personalization, and 87% plan to increase spending in 2026. [35]
-
11Personalized email hero images lift CTR by 41%, and personalized creative on paid social lifts CTR by 22% to 40%. [35]
-
12Brands with advanced personalization grow 2x faster than brands with limited or no personalization, per BCG. [34]
-
13Real-time personalization delivers 20% higher conversion than batch processing — a direct architectural argument for ERP-native platforms like Sana. [35]
-
14Personalized email flows can generate up to 18x the revenue per recipient of generic campaigns, per McKinsey. [26]
-
15B2B brands with commerce + ERP + CRM on unified data — Sana's structural moat — see personalization revenue lift 35% to 45% higher than fragmented stacks. [26,4]
-
16Sana customers report 60%+ of reorders happen without sales intervention when customer-specific pricing, catalogs, and stock are live-synced from the ERP — the operational payoff of ERP-native personalization. [14]
AI is where the next B2B platform decision gets locked in
89% of retailers have adopted AI. 7% have scaled it. For B2B mid-market manufacturers on SAP or Microsoft Dynamics, AI will land first in product classification, quote automation, and demand forecasting — all of which require clean ERP data. Sana's bet: platforms with live ERP integration deploy AI meaningfully faster than those with synced middleware copies.
-
01Generative AI and AI agents drove $262 billion in global retail revenue during the 2025 holiday season, roughly 20% of total sales. [15]
-
02Traffic from AI sources to US retail sites grew 393% YoY in Q1 2026, and 4,700% during the 2025 holiday window. [16]
-
0394% of B2B buyers now use GenAI for self-guided research, per Forrester — directly relevant to mid-market Sana customers. [11]
-
0489% of retailers have adopted AI, but only 7% have fully scaled it, per McKinsey's 2026 maturity data — B2B scale-through rates run 2 to 4 points behind retail. [26]
-
0559% of Americans use generative AI for shopping tasks, and 56% used it during the 2025 holiday season — up from 11% in 2024. [30]
-
0661% of Gen Z used AI to help with a purchase in the past year, the highest adoption rate of any demographic. [30]
-
07The global generative AI in ecommerce market hit $1.11 billion in 2026, forecast at $3.95 billion by 2035. [30]
-
08The broader AI in retail market sits at $18.64 billion in 2026, with marketing automation the top use case at 48.9% of companies. [38]
-
0969% of retailers with AI implementations report measurable revenue increases directly attributable to their AI investments. [38]
-
10AI chatbots cut cart abandonment by 20% to 30% and drive 36% more repeat purchases through post-sale engagement. [38]
-
11The global chatbot market reaches $11.80 billion in 2026, growing to $27.30 billion by 2030 at 23.3% CAGR. [30]
-
12Only 14% of consumers trust AI for autonomous purchasing, even as 73% use AI somewhere in their journey — B2B trust rates are 4 to 6 points lower. [36]
-
13Roughly 33% of online retailers will use advanced AI agents by 2028, up from under 1% today — B2B adoption follows about 12 to 18 months behind. [37]
-
1450% of B2B buyers will interact with a digital human by 2026, per sector trend research — a native use case for ERP-integrated commerce. [8]
-
15Sana Commerce ships guided analytics that turn ERP, webstore, and behavioral data into next actions — surfacing reorder opportunities and growth patterns from live ERP data. [6]
-
16Composable and ERP-native platforms — the direction Sana is architected for — reduce AI integration time by 45% to 60%, since models plug in via API without middleware rebuilds. [39]
Six patterns B2B commerce leaders on ERP-native platforms should internalize
Sana's defensible moat is reading live ERP data rather than copying it. Most B2B commerce platforms sync overnight to a separate database. Sana reads SAP or Microsoft Dynamics directly. For mid-market manufacturers where pricing, stock, and credit terms change intraday, this architectural choice meaningfully reduces error rates and support ticket volume. Compare against SAP Commerce Cloud, Adobe Commerce, and BigCommerce B2B in the ECM platforms hub before you commit.
The 'consumerization of B2B' is now operational, not aspirational. 66% of B2B buyers expect full personalization, 87% will pay more for a better digital experience, and 30% to 45% would switch suppliers for one. Mid-market manufacturers who treat the buyer portal as a cost center rather than a product will lose share to those who don't.
B2B self-service economics are extraordinary when they work. Sana customers report 60%+ of reorders happen without sales intervention when ERP data is live-synced. That's not just margin — it's sales capacity reallocated from reactive order-taking to proactive account growth.
LinkedIn is the B2B social channel that matters. 80% of B2B social leads come from LinkedIn, 94% of B2B marketers use the platform, and 75% of B2B buyers use social media to inform purchases. TikTok Shop will not become the B2B equivalent — but every B2B buyer is a consumer, and consumer platforms shape expectations.
B2B email with ERP triggers is a different animal from B2C email. Reorder reminders, contract-renewal nudges, blanket-order status, and credit-availability alerts all drive revenue when they fire on live ERP state. Sana customers running these flows see 30% to 40% higher email-attributed revenue than stitched stacks.
AI will land in B2B through product classification, quote automation, and demand forecasting first — not chatbots. 94% of B2B buyers already use GenAI for self-guided research. Platforms with live ERP integration will ship these use cases materially faster than those running on synced middleware copies, which is the full strategic case for Sana's architecture.
Frequently asked questions
What is Sana Commerce Cloud and who is it for?
Sana Commerce Cloud is a B2B ecommerce platform founded in 2007 and headquartered in Rotterdam, Netherlands. It's purpose-built to integrate directly with SAP (ECC, S/4HANA, Business One) and Microsoft Dynamics (365 F&SC, Business Central, NAV, AX) — reading live from the ERP rather than syncing to a separate database. The platform serves 1,500+ B2B customers globally, concentrated in mid-market manufacturing, distribution, and wholesale. Sana is a certified SAP partner and SAP clean-core certified with RISE. Best fit: mid-market manufacturers and distributors on SAP or Microsoft Dynamics who need B2B ecommerce without maintaining middleware.
How does Sana Commerce compare to SAP Commerce Cloud, Adobe Commerce, and BigCommerce B2B?
SAP Commerce Cloud (formerly Hybris) is the enterprise-tier platform for brands fully committed to the SAP customer experience stack — bigger, more complex, more expensive. Adobe Commerce (Magento) has deeper B2B feature breadth but requires substantial middleware or custom integration work. BigCommerce B2B offers simpler SaaS deployment but less ERP depth. Sana's unique position: ERP-native architecture that reads live from SAP or Microsoft Dynamics without middleware, which keeps pricing, inventory, and customer terms perfectly in sync. For mid-market SAP or Dynamics shops, Sana typically wins on total cost of ownership and integration simplicity.
What ERPs does Sana Commerce integrate with, and how deep is the integration?
Sana supports SAP ECC, SAP S/4HANA, SAP Business One, Microsoft Dynamics 365 Finance & Supply Chain, Microsoft Dynamics 365 Business Central, Microsoft Dynamics NAV, AX, and GP. The integration is direct — Sana reads pricing, inventory, customer and order data from the ERP each time a buyer interacts with the storefront. There's no middleware to license, host, or maintain, no second database to keep in sync, and pricing logic is configured once (inside the ERP). This is the structural moat that distinguishes Sana from middleware-based alternatives.
What conversion rate should a mid-market B2B brand on Sana target in 2026?
B2B ecommerce conversion rates average 2.5% to 4.2%, with top-quartile mid-market B2B hitting 5%+ when ERP data (pricing, stock, credit) is live-synced. Sana customers typically run above the B2B median because customer-specific pricing and stock are accurate at page load, not stale. Mobile conversion runs lower (2% to 3.5%) but is growing fast — 68% of B2B retail orders now flow through mobile. The leverage point: automated reorder flows commonly drive 15% to 20% of portal revenue by themselves, and 60%+ of Sana customer reorders happen without sales intervention.
What's the ROI case for ERP-native B2B commerce?
Elogic Commerce documents 211% to 391% three-year returns on B2B ecommerce implementations, with 6 to 8 month payback periods. For Sana specifically, the quantifiable wins are: 60%+ of reorders happening without sales intervention (freeing sales capacity), 27% lower fulfillment costs and 18% fewer abandoned carts versus fragmented stacks, 30% to 40% higher email-attributed revenue from ERP-triggered flows, and 35% to 45% higher personalization revenue lift from live ERP data versus synced middleware. For a $25M GMV mid-market manufacturer, the model typically pays back in year one and compounds across sales operations, finance, and customer service.
The playbook top eComm operators actually read
One weekly brief. Five stories that matter. Zero fluff. Written for managers at $5M–$50M DTC brands who want to sound sharper than everyone else in the meeting.
References
- 01 Sana Commerce — Official Platform Site — sana-commerce.com
- 02 Virto Commerce — Sana Commerce Alternatives Guide 2026 — virtocommerce.com
- 03 Gartner — Sana Commerce Cloud Reviews & Ratings 2026 — gartner.com
- 04 ERP Research — Sana Commerce Cloud Review 2026 — erpresearch.com
- 05 Capterra — Sana Commerce Software Review 2026 — capterra.com
- 06 G2 — Sana Commerce Cloud 2026 Reviews — g2.com
- 07 Sana Commerce — B2B E-Commerce for SAP: Top Platforms 2026 — sana-commerce.com
- 08 Sana Commerce — Top B2B E-commerce Trends 2026 — sana-commerce.com
- 09 Mordor Intelligence — Global B2B Ecommerce Market — mordorintelligence.com
- 10 Elogic Commerce — State of B2B Ecommerce 2026 — elogic.co
- 11 Forrester — 2026 B2B Buyers' Journey Survey — forrester.com
- 12 eMarketer 2026 Worldwide Retail Ecommerce Forecast — emarketer.com
- 13 Wikipedia — Enterprise Resource Planning Market 2026 — wikipedia.org
- 14 ecommerceguide — Sana Commerce ERP-Native Review — ecommerceguide.com
- 15 Adobe Analytics — 2025 Holiday Shopping Report — adobe.com
- 16 Adobe Digital Insights — AI Referral Traffic Q1 2026 — adobe.com
- 17 Omnisend — 2026 Ecommerce Marketing Statistics — omnisend.com
- 18 Klaviyo 2026 Ecommerce Benchmark Report — klaviyo.com
- 19 Litmus State of Email 2026 — litmus.com
- 20 GetResponse Email Marketing Benchmarks — getresponse.com
- 21 HubSpot State of Marketing 2026 — hubspot.com
- 22 Statista — Global Retail Mobile Commerce Sales — statista.com
- 23 Fortune Business Insights — Mobile Commerce Market — fortunebusinessinsights.com
- 24 Capital One Shopping — Mobile Ecommerce Research — capitaloneshopping.com
- 25 Baymard Institute — Cart Abandonment Research — baymard.com
- 26 McKinsey — Next in Personalization — mckinsey.com
- 27 eMarketer US Social Commerce Forecast 2026 — emarketer.com
- 28 Mordor Intelligence — Social Commerce Market — mordorintelligence.com
- 29 LinkedIn Marketing — B2B Social Commerce Benchmarks 2026 — linkedin.com
- 30 Precedence Research — Generative AI in E-commerce Market — precedenceresearch.com
- 31 Elogic Commerce — B2B Ecommerce ROI Report 2026 — elogic.co
- 32 Barilliance — Product Recommendation Statistics — barilliance.com
- 33 Salesforce — State of Commerce 2026 — salesforce.com
- 34 BCG — Profiting from Personalization — bcg.com
- 35 Twilio Segment State of Personalization 2026 — segment.com
- 36 Riskified — AI Trust in Commerce 2026 — riskified.com
- 37 Morgan Stanley — Agentic Commerce 2030 Outlook — morganstanley.com
- 38 NVIDIA — State of AI in Retail and CPG 2026 — nvidia.com
- 39 Wcart — Headless Commerce Statistics 2026 — wcart.io
- 40 Elogic Commerce — B2B Ecommerce Conversion Benchmarks 2026 — elogic.co
Make every B2B commerce decision data-backed
Join 12,000+ ecommerce managers reading the ECM newsletter every Tuesday — or browse the directory to find vetted Sana implementation, SAP/Microsoft Dynamics integration, and B2B CRO partners built for ERP-native unit economics.
Social for B2B is LinkedIn-first, demand-gen second
B2B social commerce isn't TikTok Shop. It's LinkedIn as the discovery engine, YouTube for product education, and consumer platforms for brand awareness among the end-user buyers who increasingly influence B2B purchase decisions. Sana customers typically treat social as top-of-funnel, with the actual self-service transaction happening on the ERP-integrated storefront.