


Last Updated on August 19, 2026
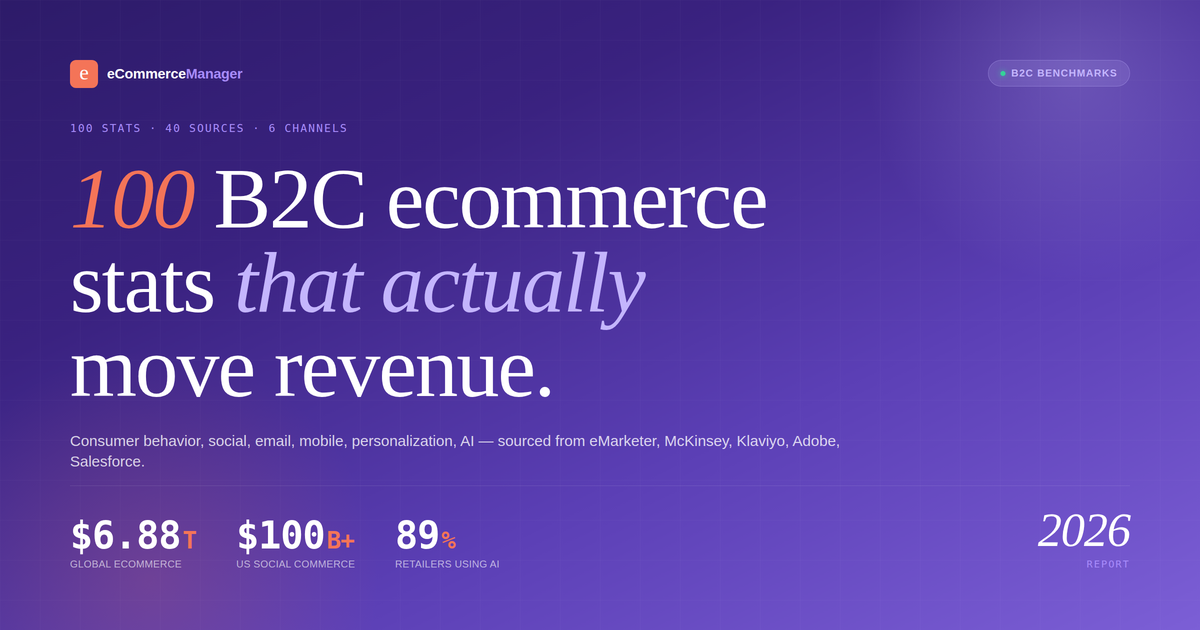
100 B2C Ecommerce Statistics for 2026: Consumer Behavior, Social, Email, Mobile, Personalization & AI
The 100 numbers B2C operators need for 2026 planning — sourced from eMarketer, McKinsey, Klaviyo, Adobe, Salesforce, and the platforms themselves.
On this page
The state of B2C ecommerce, in 100 numbers
Global retail ecommerce hits $6.88 trillion in 2026, US sales grew 9.8% year over year in Q1, and mobile finally caught desktop on conversion. Those are the headlines. The rest of this report is the fine print — what shoppers actually do, which channels are pulling weight, and where AI is (and isn't) moving revenue.
Every stat below is sourced. Where sources disagree, both figures are shown. Skim the sections that matter to your quarter, and use the platform calculator or directory to act on what stands out.
How B2C shoppers buy in 2026
The average path to purchase now runs across 28 touchpoints, and shipping fees still kill more sales than every other checkout objection combined. These 17 numbers show what the modern shopper actually does, not what they say in surveys.
-
01Global retail ecommerce is projected to reach $6.88 trillion in 2026, representing 21.1% of all retail sales worldwide. [1]
-
02US ecommerce sales hit $326.7 billion in Q1 2026, up 9.8% year over year, and now account for 16.9% of total US retail. [4]
-
03Global B2C ecommerce revenue is forecast to reach $5.5 trillion by 2027, growing at roughly 7% CAGR. [1]
-
04Approximately 2.86 billion people will shop online globally in 2026, about 33% of the world's population. [22]
-
0573% of retail shoppers now use multiple channels in a single purchase journey, and the average touchpoint count reached 28.87 in 2025. [18]
-
0683% of shoppers look up products online before visiting a physical store, and 72% use their phones in-store to check prices. [18]
-
07The average shopping cart abandonment rate is 70.22% across all devices, per Baymard's most recent meta-analysis. [16]
-
08More than 90% of shoppers abandon a purchase when shipping costs feel too high, the top-ranked reason for checkout drop-off. [16]
-
09US consumers returned $890 billion in merchandise in 2024, at an average ecommerce return rate of 16.9%. [15]
-
1070% of online shoppers have bought from retailers based outside their own country, making cross-border readiness a real growth lever. [22]
-
1143% of consumers cite inflation as their top concern, 79% are trading down, and mass merchants captured 83% of that spend shift. [18]
-
1295% of consumers refuse to buy from brands they consider non-secure, and privacy investments deliver a 1.6x ROI, per Cisco. [18]
-
13Consumer checkout completion stays flat at roughly 2.5% to 3% globally, essentially unchanged in five years despite record ad spend. [16]
-
14Consumer electronics and fashion lead category growth globally, forecast at $1.1 trillion and $1.3 trillion in 2027. [1]
-
15Loyalty program members purchase 81% more frequently and spend 76% more per transaction than non-members, per Rivo's 2026 benchmark data. [34]
-
16Retailers with unified commerce systems report 27% lower fulfillment costs and 18% fewer abandoned carts than fragmented peers. [18]
-
17US ecommerce loses $48 billion to fraud annually, and false declines (legitimate orders wrongly rejected) cost another $443 billion. [40]
Picking a platform for the next $5M?
Cross-reference these consumer and social numbers against Shopify, BigCommerce, WooCommerce, and Adobe Commerce in the ECM platform calculator.
Email still prints money
Automated flows are 2% of email volume and 30% to 37% of revenue. That gap is where the real work is. If your email program is contributing less than a third of store revenue, your automation is the problem, not your list.
-
01Ecommerce email marketing delivers $45 for every $1 spent in retail and consumer goods, rising to $72 for US ecommerce merchants running optimized programs. [5,7]
-
02Global ecommerce campaign open rates averaged 30.7% in 2025, up from 26.6% in 2024. That's five consecutive years of increase. [5]
-
03Automated emails accounted for 2% of sends in 2025 but drove 30% of total email revenue, earning 16x more per send than scheduled campaigns. [5]
-
04Welcome emails hit an 83.6% open rate, the highest of any automated email type in ecommerce. [26]
-
05Abandoned cart emails achieve the highest CTR of any automation at 23.33%, and convert at 3.33% on average (7.69% for top performers). [5]
-
06Segmented campaigns generate 760% more revenue than non-segmented sends, per Klaviyo's benchmark data. [6]
-
07Personalized email subject lines lift open rates by 26%, and AI-generated subject lines outperform human-written ones by the same margin. [5]
-
0859% of marketers name email their most effective channel for revenue, ahead of social (14%) and paid search (12%). [8]
-
09Ecommerce brands using email marketing generate 17% more revenue than those that don't, per Klaviyo's 2026 benchmark. [6]
-
10Average revenue per email is $0.08 to $0.12 for B2C and $0.15 to $0.25 for B2B, depending on segmentation depth. [5]
-
11Automated welcome emails in ecommerce have an average conversion rate of nearly 3%, the highest of any triggered flow. [26]
-
1244.14% of all email clicks happen within 60 minutes of send, per GetResponse. Send-time optimization matters more than list size. [26]
-
1364% of email opens now happen on mobile devices, and non-mobile-optimized emails get deleted within seconds. [8]
-
14Global email users will reach 4.73 billion by 2026, sending 392.5 billion daily emails, per Radicati. [20]
-
15The global email marketing market grows from $11.5 billion in 2025 to $17.9 billion by 2028, a 15.8% CAGR. [20]
-
16Nearly 50% of consumers report making a direct purchase from an email in the past year, per Litmus. [7]
-
17A well-performing email program should drive 30% to 40% of total store revenue. Anything less signals underinvestment in automation. [6]
The mobile handoff is done
Mobile is 60% of global ecommerce and 78% of traffic. The gap between mobile web and native app performance is now the biggest optimization lever most brands ignore. Apps convert at 3.5%. Mobile web sits at 2%. That's the whole story.
-
01The global mobile commerce market is projected at $2.4 trillion in 2026, growing at a 9.5% CAGR through 2034. [14]
-
02Mobile now drives 60% of all ecommerce sales worldwide and 78% of retail website traffic. [13]
-
03US retail mcommerce is forecast at 44.6% of total US retail ecommerce and hit $542.73 billion in 2024. [13]
-
04The average mobile ecommerce conversion rate reached 2.8% in 2026, finally matching desktop after years at 1.8%. [15]
-
05Shopping apps convert at 3.5%, roughly 75% higher than mobile web at 2%, per Fortune Business Insights. [14]
-
06Mobile cart abandonment sits at 80% to 84%, compared to 66.4% on desktop. [15,16]
-
0788% of consumers use mobile shopping apps, and 52% use them at least weekly. [15]
-
08Average mobile order value is $112.29, versus $155 on desktop, a $43 gap that represents billions in unrealized revenue. [15]
-
09Food and beverage leads mobile conversion at 6.11%, while luxury goods sits at just 1.19%, reflecting longer research cycles on high-ticket items. [15]
-
10AR shopping experiences drive up to 94% higher conversion rates by letting shoppers visualize products in their own space before buying. [15]
-
11Global mobile wallets are projected to process $16 trillion+ in transactions in 2026, with 5+ billion active users. [27]
-
1276% of US adults have shopped online using a smartphone, and 32% do so weekly or more often. [15]
-
13Reducing mobile page load time by 1 second increases conversion by 5.6%, per Google's Core Web Vitals data. [13]
-
14Mobile apps account for 54% of mobile commerce transactions, and time-in-app is 18x higher than mobile web. [14]
-
15The Asia-Pacific region generates over 55% of global mobile commerce revenue, led by China, India, and Southeast Asia. [13]
-
16Global mobile commerce revenue is forecast to hit $3.35 trillion by 2028. [13]
-
1770% of purchases in 2024 occurred via mobile apps versus mobile web, reflecting consumer preference for streamlined app checkout. [14]
Automation is 2% of sends and 30% of revenue.
If your email program isn't there yet, browse vetted lifecycle and retention agencies in the ECM directory.
The revenue lift most brands leave on the table
McKinsey pegs the revenue lift at 5% to 15% for well-implemented personalization. That range is wide because most brands are somewhere on it, not at the top of it. The gap between average and excellent is measured in eight-figure revenue swings for mid-market DTC.
-
01Well-implemented personalization drives revenue increases of 10% to 30%, depending on vertical and program maturity. [9]
-
0271% of consumers expect personalized interactions from the brands they buy from, and 76% get frustrated when brands don't deliver. [9]
-
03Personalized product recommendations account for 26% to 31% of ecommerce revenue for stores that implement them. [33,17]
-
04Amazon attributes 35% of total revenue to its recommendation engine, the benchmark most personalization vendors quote. [33]
-
05Shoppers who click a recommendation are 4.5x more likely to add to cart and spend 5x more than average shoppers. [33]
-
0680% of consumers are more likely to purchase from brands that offer personalized experiences, per Epsilon. [34]
-
0745% of ecommerce stores use some form of personalization in 2026, up from 28% in 2023. [24]
-
08Personalization delivers 5x to 8x ROI on implementation costs, with stores seeing 15% to 30% higher conversion and 10% to 20% higher AOV. [9]
-
09Fast-growing companies generate 40% more revenue from personalization than their slower-growing competitors. [9]
-
10Personalized CTAs convert 202% better than generic ones, per Involve.me's cross-industry testing data. [24]
-
1189% of marketers report positive ROI from personalization programs, and 87% plan to increase spending in 2026. [24]
-
12Personalized email hero images lift CTR by 41%, and personalized creative on paid social lifts CTR by 22% to 40%. [35]
-
13Brands with advanced personalization grow 2x faster than brands with limited or no personalization, per BCG. [19]
-
14Real-time personalization delivers 20% higher conversion than batch processing, and 40% revenue lift at the excellence tier. [24]
-
15Personalized email flows can generate up to 18x the revenue per recipient of generic campaigns, per McKinsey. [9]
-
1660% of consumers become repeat buyers after a personalized experience, and members feel 8x more satisfied when loyalty programs feel personalized. [34]
Where AI actually moves numbers
89% of retailers have adopted AI. 7% have scaled it. That 82-point gap is the entire story of AI in commerce right now. Everyone is running pilots. Almost no one is running production. The brands that close the gap first will compound the advantage.
-
01Generative AI and AI agents drove $262 billion in global retail revenue during the 2025 holiday season, roughly 20% of total sales. [2]
-
02Traffic from AI sources to US retail sites grew 393% YoY in Q1 2026, and 4,700% year over year during the 2025 holiday window. [3]
-
03AI-referred traffic converts 31% to 42% higher than non-AI traffic, and those shoppers spend 45% more time on retailer sites. [3]
-
0489% of retailers have adopted AI, but only 7% have fully scaled it, per McKinsey and Stord's 2026 maturity data. [25]
-
0559% of Americans use generative AI tools for shopping tasks, and 56% used it during the 2025 holiday season, up from 11% in 2024. [10]
-
0661% of Gen Z used AI to help with a purchase in the past year, the highest adoption rate of any demographic. [10]
-
07The global generative AI in ecommerce market hit $1.11 billion in 2026, up from $962 million in 2025, and is forecast at $3.95 billion by 2035. [10]
-
08The broader AI in retail market sits at $18.64 billion in 2026, with marketing automation the top use case at 48.9% of companies. [36]
-
0969% of retailers with AI implementations report measurable revenue increases directly attributable to their AI investments. [36]
-
10AI chatbots cut cart abandonment by 20% to 30% and drive 36% more repeat purchases through post-sale engagement. [36]
-
11The global chatbot market reaches $11.80 billion in 2026 and is forecast to hit $27.30 billion by 2030, a 23.3% CAGR. [10]
-
12Only 14% of consumers trust AI for autonomous purchasing, even as 73% use AI somewhere in their shopping journey. [30]
-
13Roughly 33% of online retailers will use advanced AI agents by 2028, up from under 1% today, potentially influencing $385 billion in US ecommerce by 2030. [32]
-
1446% of DTC brands used AI-generated product visuals in 2026, and 68% of Gen Z shoppers are more likely to buy when visuals reflect people like them. [35]
-
15AI implementation improves ecommerce customer retention by 10% to 15%, per Capital One Shopping research. [15]
-
1675% of consumers prefer AI chatbots over human agents for straightforward questions, provided the AI stays accurate and on-brand. [36]
Six patterns to internalize
Automation is the ROI multiplier across every channel. 2% of email sends generating 30% of revenue is the pattern to internalize — the same math applies to SMS flows, retargeting, and increasingly agent-driven shopping. If your automations are a small fraction of your program, that's not a maturity issue. That's the entire opportunity.
Mobile finally matched desktop on conversion — but only in aggregate. Apps convert at 3.5% and mobile web at 2%. The brands winning mobile are the ones treating the app as a distinct product, not a smaller version of the website.
Social commerce is TikTok Shop's story. $15.82 billion in US sales in 2025, 108% growth, and a conversion rate 2.6x Facebook's. Meta still wins on reach, but every dollar of TikTok Shop revenue is closing faster than anywhere else in the funnel.
AI adoption looks universal (89%) but is essentially still a pilot exercise (7% scaled). The gap will close over the next 24 months. First movers on scaled, revenue-attached AI — not experiments — will compound.
Personalization revenue lift ranges from 5% to 30% because most brands live at the bottom of that band. Getting from 5% to 15% is mostly execution: better data, better recommendations, better email segmentation. The tech isn't the constraint anymore.
Trust is the ceiling on all of it. 95% of consumers won't buy from non-secure brands. Only 14% trust AI for autonomous purchases. Every technology story in commerce right now runs into consumer trust as the rate-limiter.
Frequently asked questions
What percentage of retail is ecommerce in 2026?
Global retail ecommerce reached 21.1% of total retail in 2026, per eMarketer's 2026 forecast. In the US specifically, ecommerce accounted for 16.9% of total retail in Q1 2026, per US Census Bureau data. The share continues to climb roughly 1 point per year, with mature markets like the UK and South Korea already above 30%.
What's the average ecommerce conversion rate?
Global ecommerce conversion rates sit at 2.5% to 3% on average, essentially unchanged in five years. Mobile web averages 2%, mobile apps 3.5%, and desktop around 2.8%. Category matters more than device — food and beverage converts at 6.11% while luxury sits at 1.19%. Cart abandonment averages 70.22% overall and 80% on mobile.
How much do brands spend on personalization and what's the ROI?
89% of marketers report positive ROI from personalization, and well-implemented programs return 5x to 8x on implementation costs. McKinsey's benchmark is 5% to 15% revenue lift, with fast-growing companies driving 40% more revenue from personalization than slower peers. Amazon attributes 35% of total revenue to its recommendation engine — the ceiling most vendors point to when quoting potential.
Is TikTok Shop actually beating Instagram Shopping?
On conversion, yes. TikTok Shop converts at 4.7% versus Instagram Shopping at 2.1% and Facebook Shops at 1.8%. On reach, no — Facebook Marketplace still leads with 51.2% of consumers naming it as their most recent social purchase. TikTok Shop grew 108% year over year in the US in 2025 and captured 18.2% of total US social commerce.
How many retailers have adopted AI, and what use cases matter?
89% of retailers have adopted AI in some form, but only 7% have reached fully scaled deployment. The top use cases are marketing automation (48.9%), virtual agents and chatbots (31%), and data analytics (29%). When retailers rank priorities instead of current use, personalized recommendations (47%) and conversational AI (39%) move up the list. Agentic commerce is coming — Morgan Stanley forecasts 33% of retailers using advanced AI agents by 2028, influencing $385 billion in US ecommerce by 2030.
The playbook top eComm operators actually read
One weekly brief. Five stories that matter. Zero fluff. Written for managers at $5M–$50M DTC brands who want to sound sharper than everyone else in the meeting.
References
- 01 eMarketer 2026 Worldwide Retail Ecommerce Forecast — emarketer.com
- 02 Adobe Analytics — 2025 Holiday Season Recap — adobe.com
- 03 Adobe Digital Insights — AI Referral Traffic Q1 2026 — adobe.com
- 04 U.S. Census Bureau Quarterly Retail E-Commerce Sales, Q1 2026 — census.gov
- 05 Omnisend 2026 Ecommerce Marketing Statistics Report — omnisend.com
- 06 Klaviyo 2026 Ecommerce Benchmark Report — klaviyo.com
- 07 Litmus State of Email 2026 — litmus.com
- 08 HubSpot State of Marketing 2026 — hubspot.com
- 09 McKinsey — Next in Personalization 2023 — mckinsey.com
- 10 Precedence Research — Generative AI in E-commerce Market — precedenceresearch.com
- 11 eMarketer US Social Commerce Forecast 2026 — emarketer.com
- 12 Mordor Intelligence — Social Commerce Market — mordorintelligence.com
- 13 Statista — Global Retail Mobile Commerce Sales — statista.com
- 14 Fortune Business Insights — Mobile Commerce Market — fortunebusinessinsights.com
- 15 Capital One Shopping — Mobile Ecommerce Research — capitaloneshopping.com
- 16 Baymard Institute — Cart Abandonment Research — baymard.com
- 17 Salesforce Shopping Index Q4 2025 — salesforce.com
- 18 StartUs Insights — B2C Trends 2026 — startus-insights.com
- 19 BCG — Profiting from Personalization — bcg.com
- 20 Radicati Group — Email Statistics Report 2024-2028 — radicati.com
- 21 Digital Commerce 360 — 2026 US Ecommerce Report — digitalcommerce360.com
- 22 Datareportal — Digital 2026 Global Overview — datareportal.com
- 23 WARC Global Advertising Expenditure Report Q1 2026 — warc.com
- 24 Twilio Segment State of Personalization 2026 — segment.com
- 25 McKinsey — The State of AI 2025 — mckinsey.com
- 26 GetResponse Email Marketing Benchmarks — getresponse.com
- 27 PYMNTS — Digital Wallet Adoption Report 2026 — pymnts.com
- 28 Meta — 2026 Shoppable Ads Report — about.fb.com
- 29 Insider Intelligence — Livestream Shopping Forecast — insiderintelligence.com
- 30 Riskified — AI Trust in Commerce 2026 — riskified.com
- 31 Shopify — Commerce Trends 2026 — shopify.com
- 32 Morgan Stanley — Agentic Commerce 2030 Outlook — morganstanley.com
- 33 Barilliance — Product Recommendation Statistics — barilliance.com
- 34 Epsilon — Power of Me Personalization Study — epsilon.com
- 35 Vogue Business — DTC Visual AI Report 2026 — voguebusiness.com
- 36 NVIDIA — State of AI in Retail and CPG 2026 — nvidia.com
- 37 BigCommerce 2026 DTC Benchmarks — bigcommerce.com
- 38 Bain, Google & Temasek — e-Conomy SEA 2025 — bain.com
- 39 Amra & Elma — Social Commerce Statistics 2026 — amraandelma.com
- 40 Merchant Risk Council — 2026 Global Payments and Fraud Report — merchantriskcouncil.org
Make every B2C decision data-backed
Join 12,000+ ecommerce managers reading the ECM newsletter every Tuesday — or browse the directory to find vetted CRO, retention, and AI partners.

Social platforms as sales channels
US social commerce crosses $100 billion for the first time this year. TikTok Shop is doing the heavy lifting on conversion; Facebook Marketplace still owns reach. The gap between the two says more about buyer intent than platform quality.